February 21, 2018
Moses Stock Analysis
2354.TW Foxconn Technology Co and 50% Fibonacci Retracement
See chart for more, swing low from 2016 Low, the price action retrace pass 50%. Can the price action bounce back up? This is a question, the stock take such a long time to begin a ‘good’ retracement and only pass 50%. This stock has been seen by traders as a ‘good’ stock. But, starting mid last year the stock begin to decline. Why? Some may have the answer, as this company is the Apple iPhone outsource manufacturing company. With the iPhone demand is not like the earlier model, plus with the US new policy to encourage setting up plant in America. Everyone is watching what is the ace up Foxconn’s sleeve while the major client is declining in production.
Of course, to some this might be a good time to buy. As the stock price is much cheaper compare to the past.
Manage your risk!
Powerful Chart Software – AmiBroker
The following chart is produced using AmiBroker charting software. It is a powerful chart software. You plot the stocks you are interested all in one chart, as long as you still could read them. See chart below.
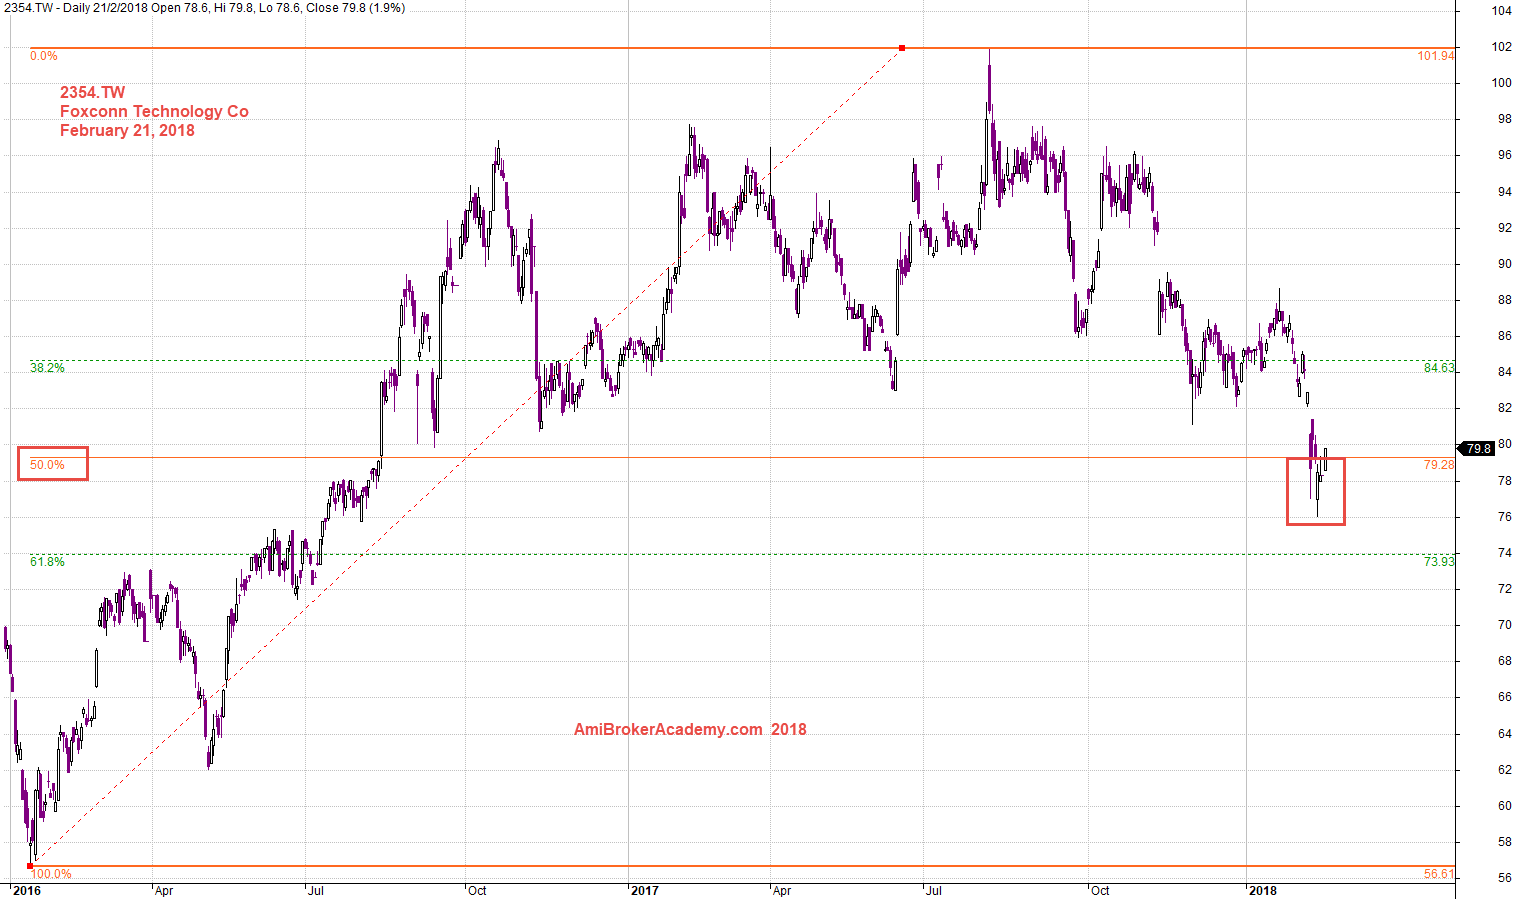
20180221 Foxconn Technology Co and Fibonacci Retracement
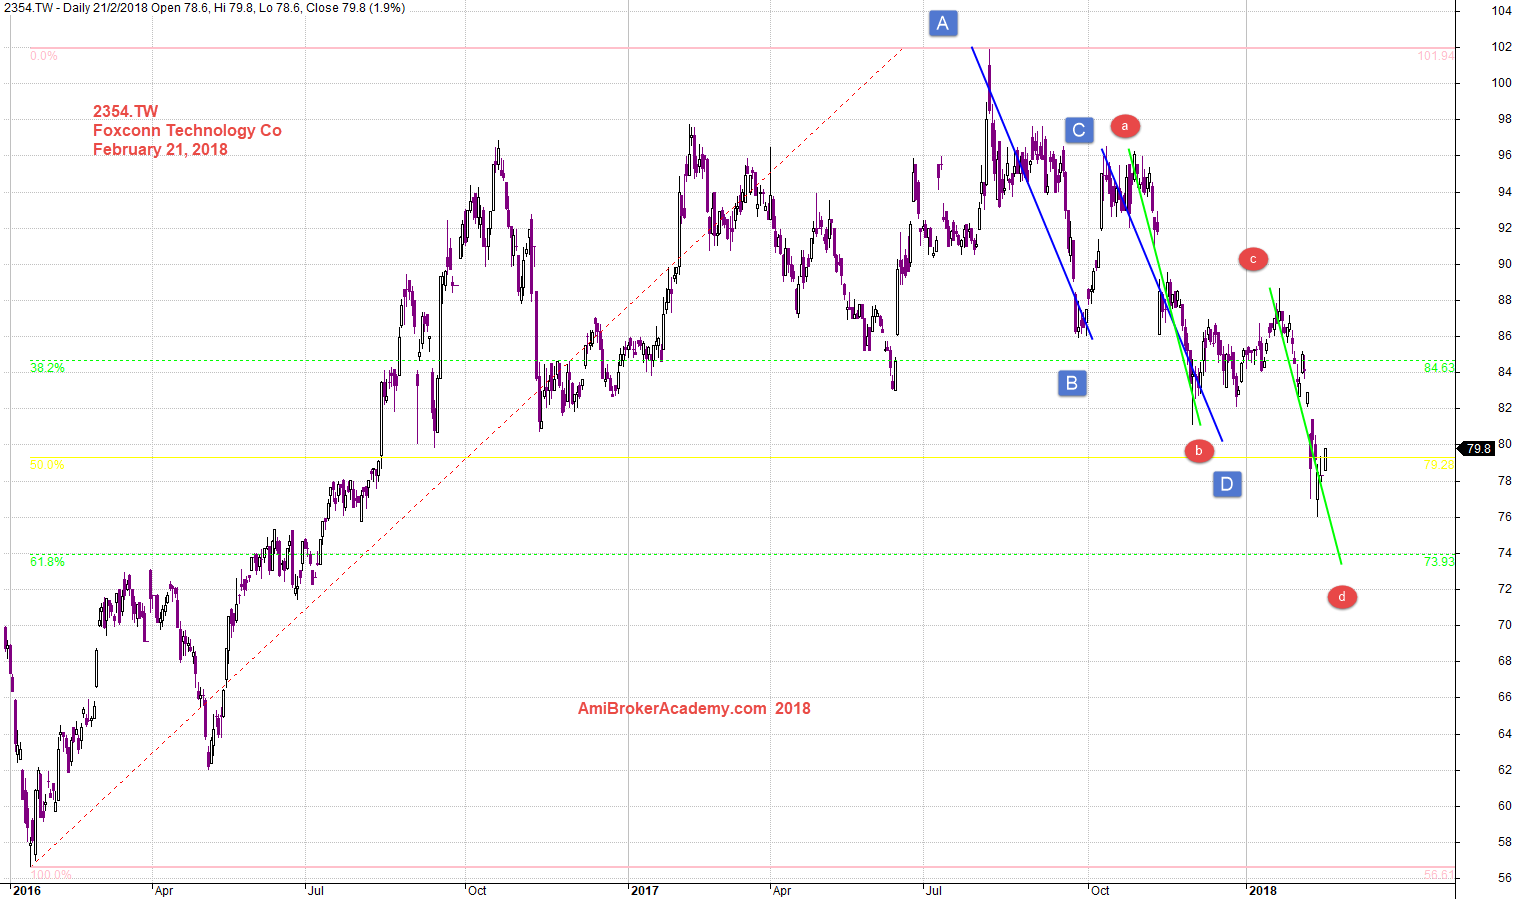
2354.TW Foxconn Technology Co and H M Gartley Top ABCD
See chart for more.
Manage your risk.
20180221 Foxconn Technology Co and ABCD
2354.TW Foxconn Technology Co and MA Band
See chart for more. A good time to buy as the stock price is lower than the October low now. Manage your risk.
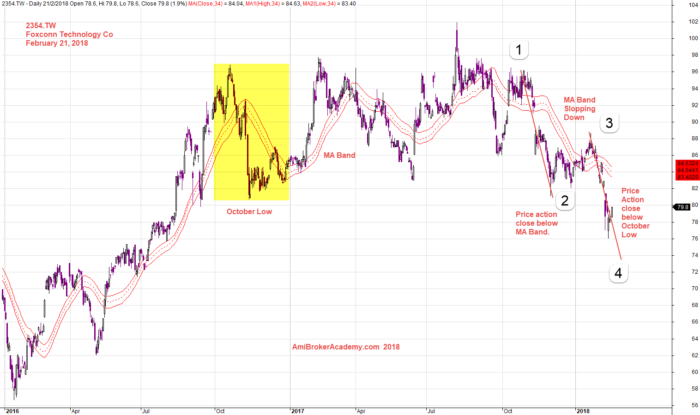
20180221 Foxconn Technology Co and MA Band
Moses
AmiBrokerAcademy.com
Disclaimer
The above result is for illustration purpose. It is not meant to be used for buy or sell decision. We do not recommend any particular stocks. If particular stocks of such are mentioned, they are meant as demonstration of Amibroker as a powerful charting software and MACD. Amibroker can program to scan the stocks for buy and sell signals.
These are script generated signals. Not all scan results are shown here. The MACD signal should use with price action. Users must understand what MACD and price action are all about before using them. If necessary you should attend a course to learn more on Technical Analysis (TA) and Moving Average Convergence Divergence, MACD.
Once again, the website does not guarantee any results or investment return based on the information and instruction you have read here. It should be used as learning aids only and if you decide to trade real money, all trading decision should be your own.