March 14, 2018
China Shanghai Stock Analysis
600605.SS Huitong Energy Company 汇通能源 From 2006 Charting
Study the big big picture of this Shanghai Stock Huitong Energy Company 汇通能源, the price action had two strong speaks, the bottom was as low as 4, but the highest high was 31. The price action now is not that low.
Manage your risk.
Powerful Chart Software – AmiBroker
The following chart is produced using AmiBroker charting software. It is a powerful chart software. You plot the stocks you are interested. You can choose the period you want, see the chart below.
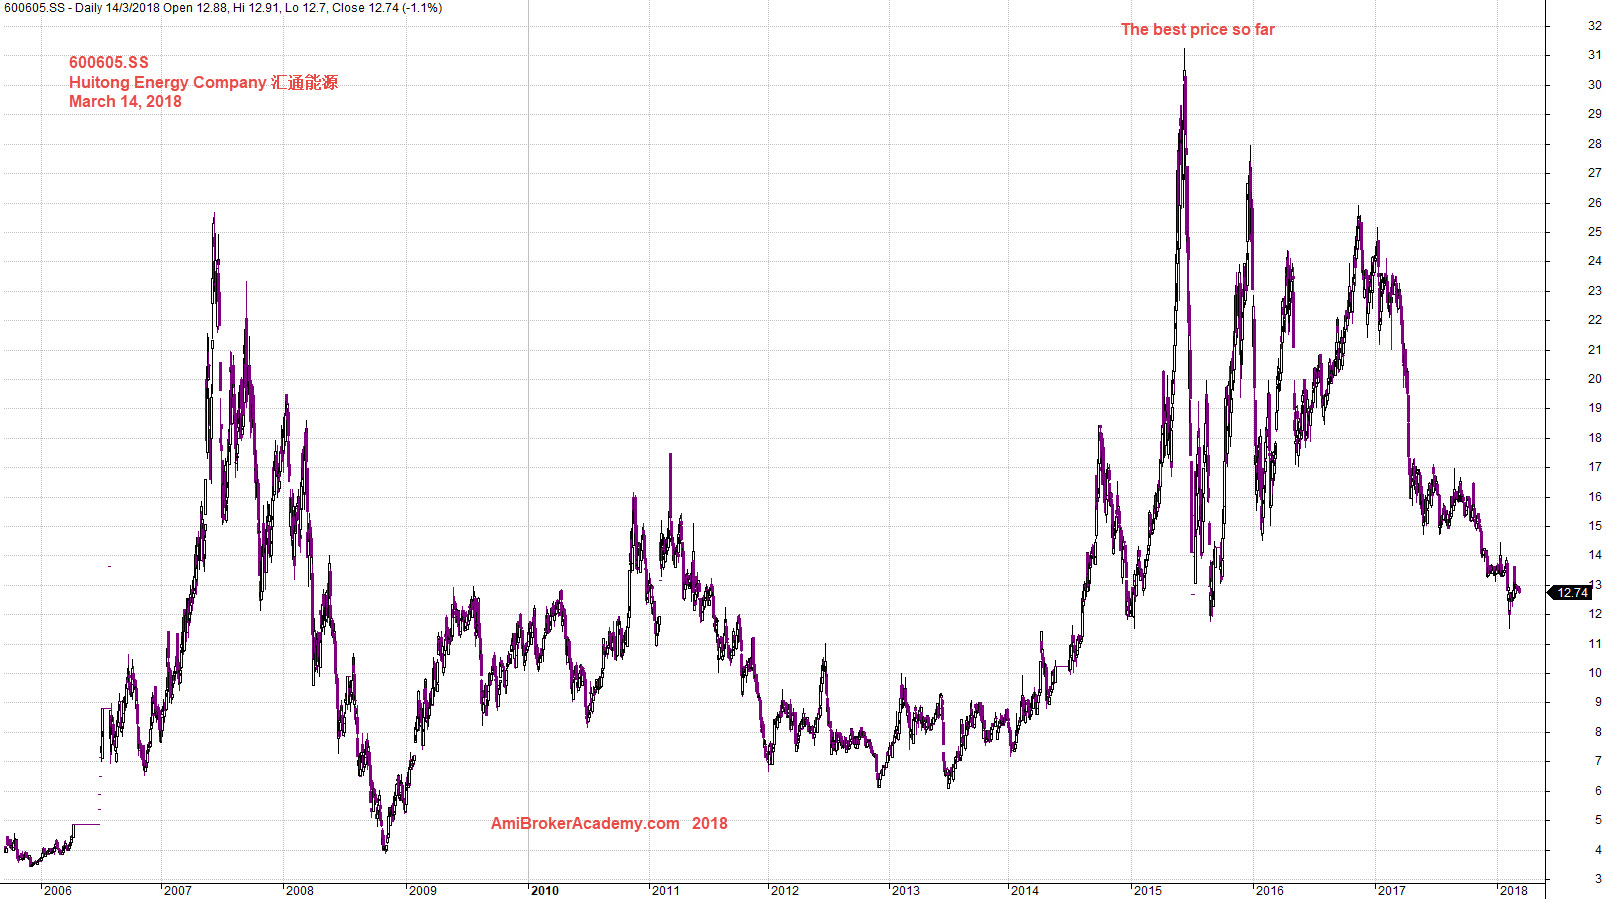
March 14, 2018 (Not Day Close) Huitong Energy Company 汇通能源 from 2006
Huitong Energy Company 汇通能源 and Channel
See chart, it was bullish channel, slopping up from bottom left to top right, but from 2017, the price action was keep going lower. The new channel was bearish.
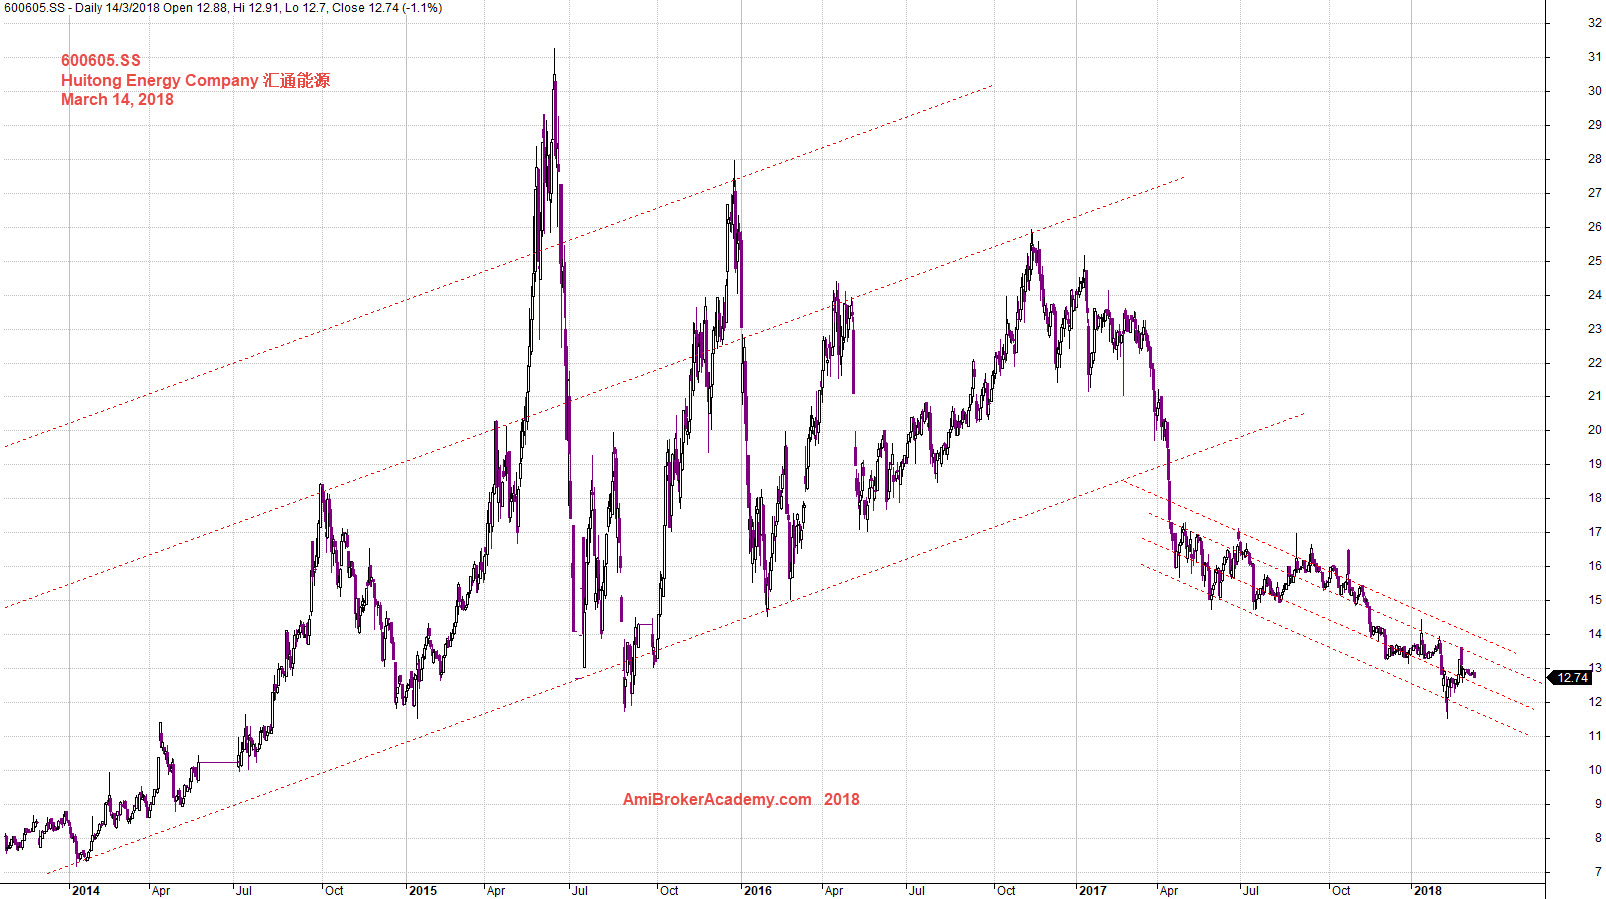
20180314 Huitong Energy Company 汇通能源 and Channels
Huitong Energy Company 汇通能源 and Channel
Study the chart from the year high low perspective, you find the recent support was once a resistance turns support and now supported again. See chart for more.
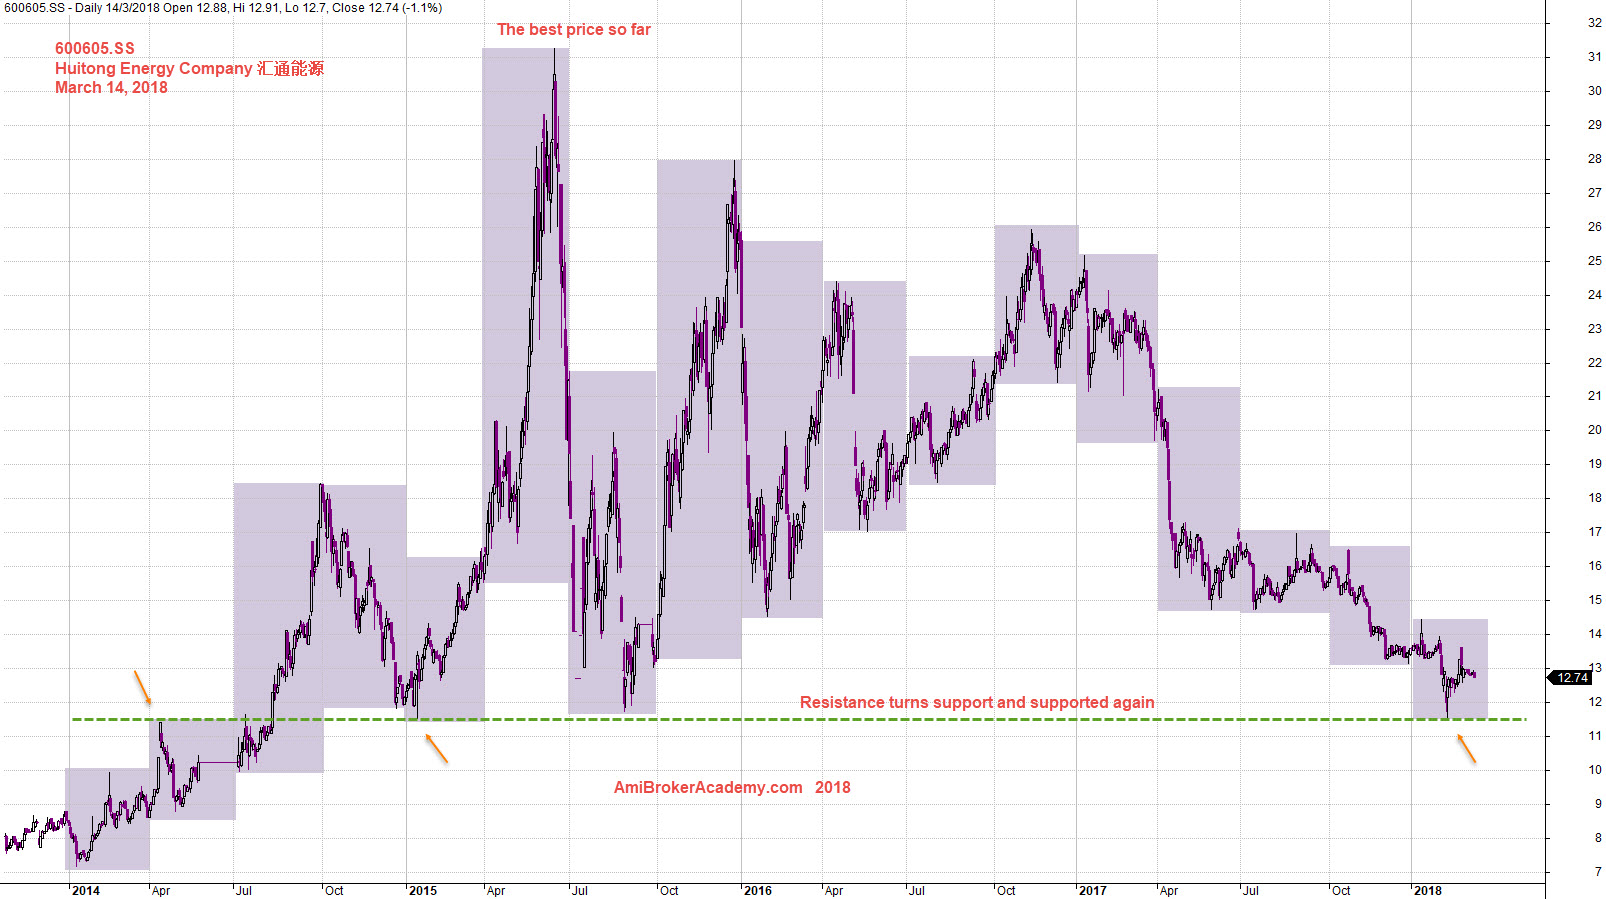
20180314 Huitong Energy Company 汇通能源 and Year High Low
Huitong Energy Company 汇通能源 and MACD
From MACD perspective, it is bearish for now. See chart for more.
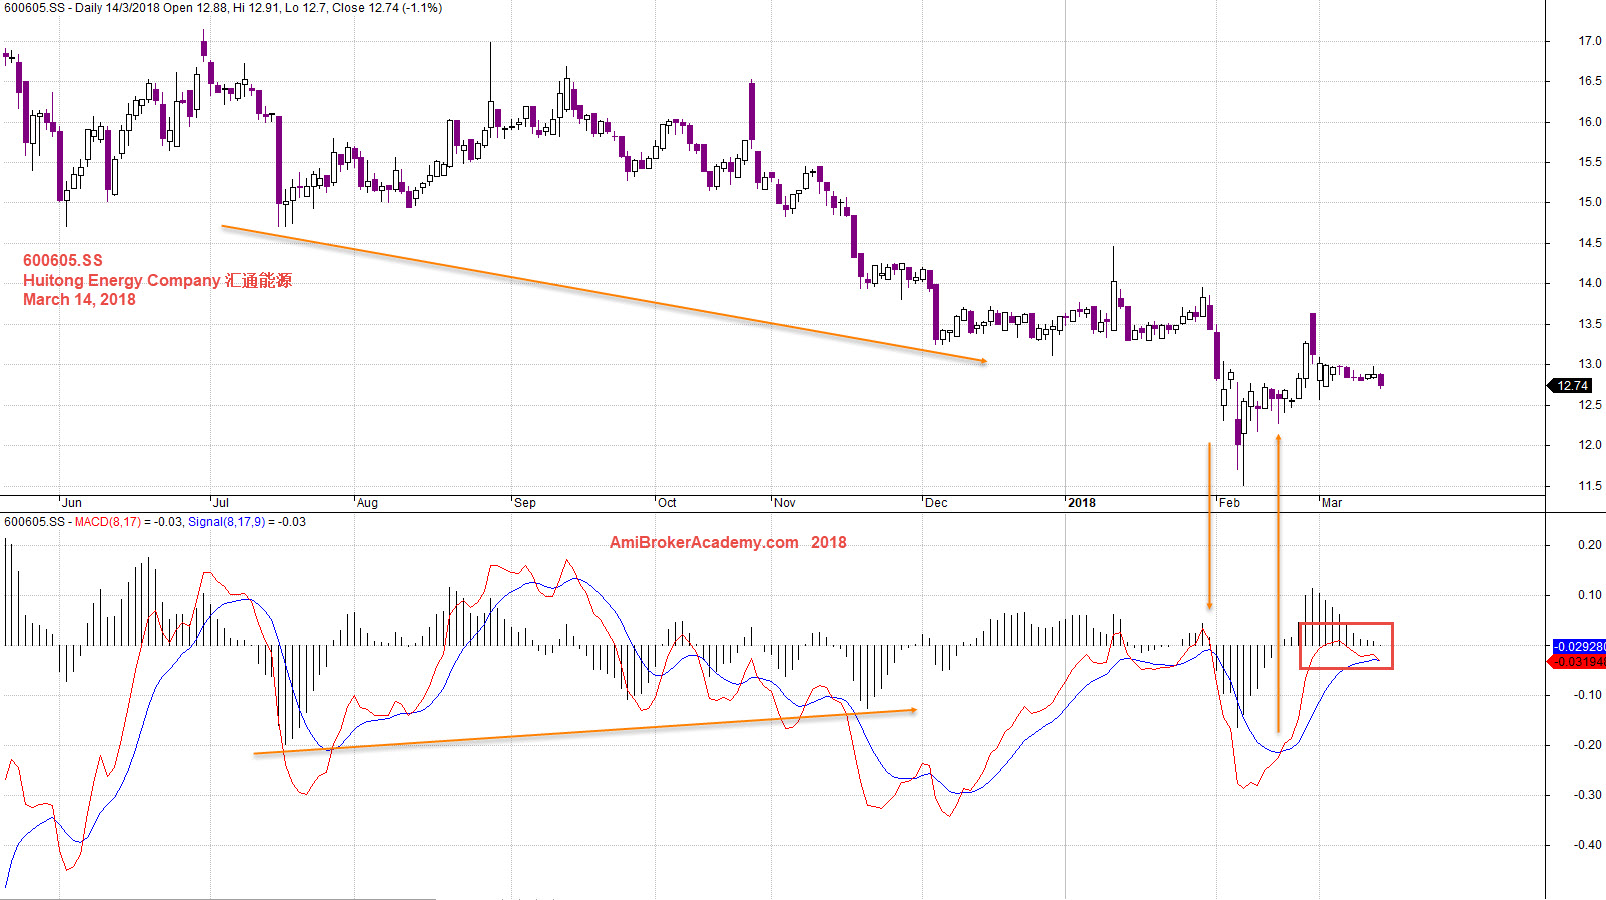
20180314 Huitong Energy Company 汇通能源 and MACD
Moses
AmiBrokerAcademy.com
Disclaimer
The above result is for illustration purpose. It is not meant to be used for buy or sell decision. We do not recommend any particular stocks. If particular stocks of such are mentioned, they are meant as demonstration of Amibroker as a powerful charting software and MACD. Amibroker can program to scan the stocks for buy and sell signals.
These are script generated signals. Not all scan results are shown here. The MACD signal should use with price action. Users must understand what MACD and price action are all about before using them. If necessary you should attend a course to learn more on Technical Analysis (TA) and Moving Average Convergence Divergence, MACD.
Once again, the website does not guarantee any results or investment return based on the information and instruction you have read here. It should be used as learning aids only and if you decide to trade real money, all trading decision should be your own.