August 25, 2017
Random Walk
Is there a predictable behavior on financial market such as “Wall Street”? Random walker will believe there isn’t one. True or true?
If you are trading on bar by bar, you do not careless. Or if you are a scalper.
However, as a swing trader you will have to choose your stand. If you agree with random walker, we suggest you change your trading style. As there is anything for your to base on for your trading strategy. There aren’t any chart pattern to reference to.
So, you are pretty sure, we are not random walker. We believe the chart pattern, we believe the predictability. However, we understand all setup can fail. And there isn’t right or wrong.
Hong Kong Hang Seng Index and Bar by Bar
See chart for more, picture worth a thousand words.
Share price retest the same high again. Two things will happen, one the trend continue, second the trend reverse.
In the chart below, we see the last bar is a bullish bar breakout higher then the previous bar by half, strong bull. The strength can be exhausted for the next bar. It is more likely a small bar, or call insider bar will happen.
For a random walker, you do not care the next more from a pattern point of view. You just continue to read the bar and guess the next bar. In fact, you are still reference to the possibility and from the past experience. For me, I see these gesture as no longer random waling, we are very much a non-random walker. In fact for technical analysis, you tent to believe the pattern will repeat.
Watch the index next week, for more.
Note:
Just a side note, over here (mean the web site) we do not just analyse chart, we also bring to you some knowledge that you may already know. Or something which is totally new to you. We give you an opportunity to research into the new knowledge (to you) in your spare time. Google is a good start point.
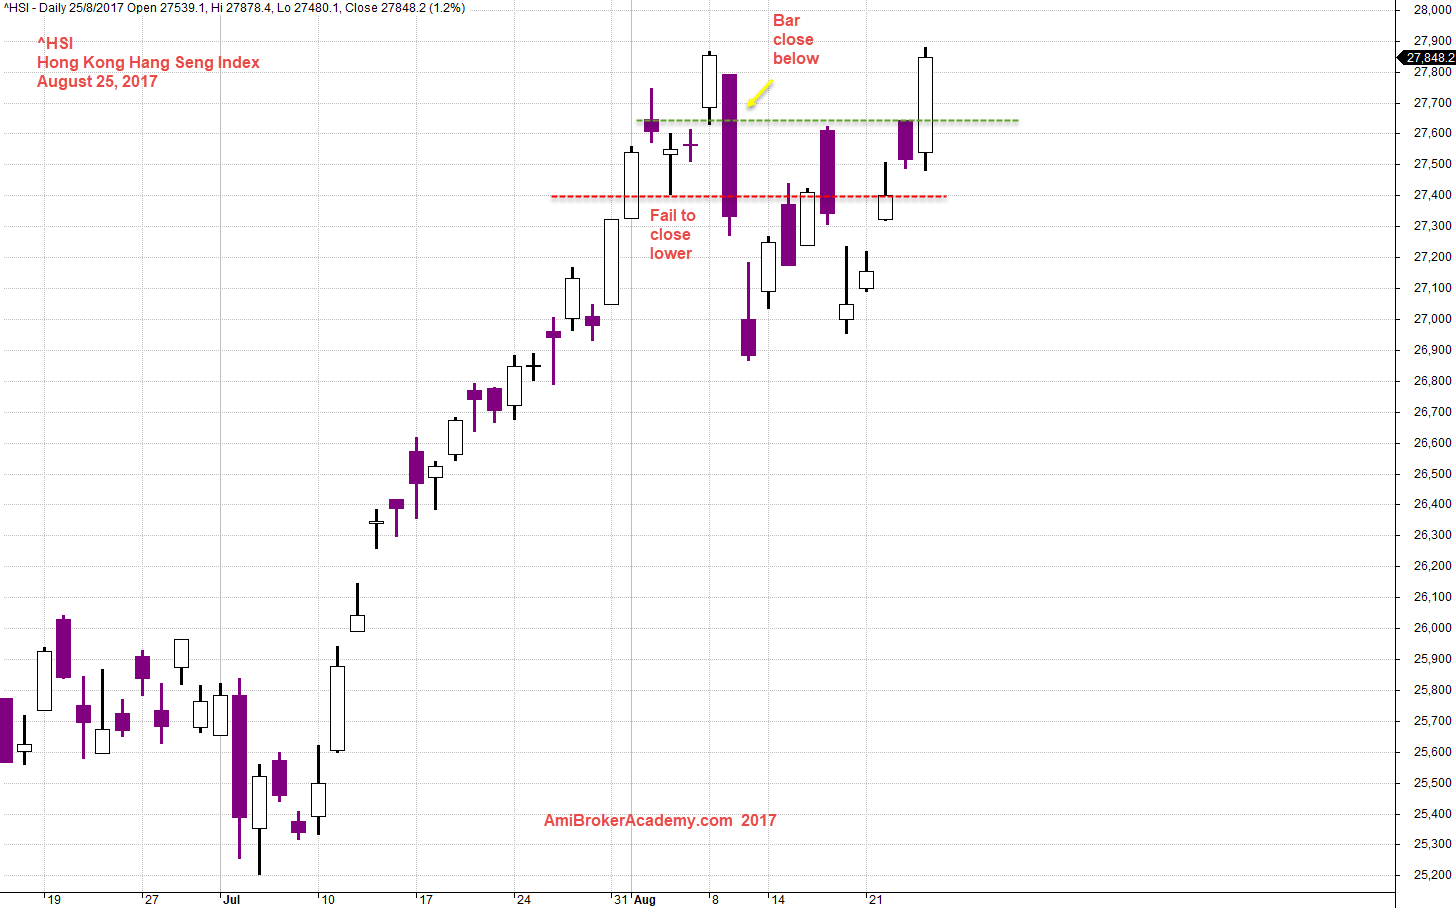
August 25, 2017 Hong Kong Hang Seng Index and Bar by Bar
^HSI Hong Kong Hang Seng Index and ABCD Chart Pattern
Picture worth a thousand words. See chart for more.
Can you see the ABCD chart pattern? From a Gartley ABCD Sell Pattern. The next move is going to be bearish. Of course, it may not be immediate. As long as the bearish is final within the next five bars. This means the setup does not fail.
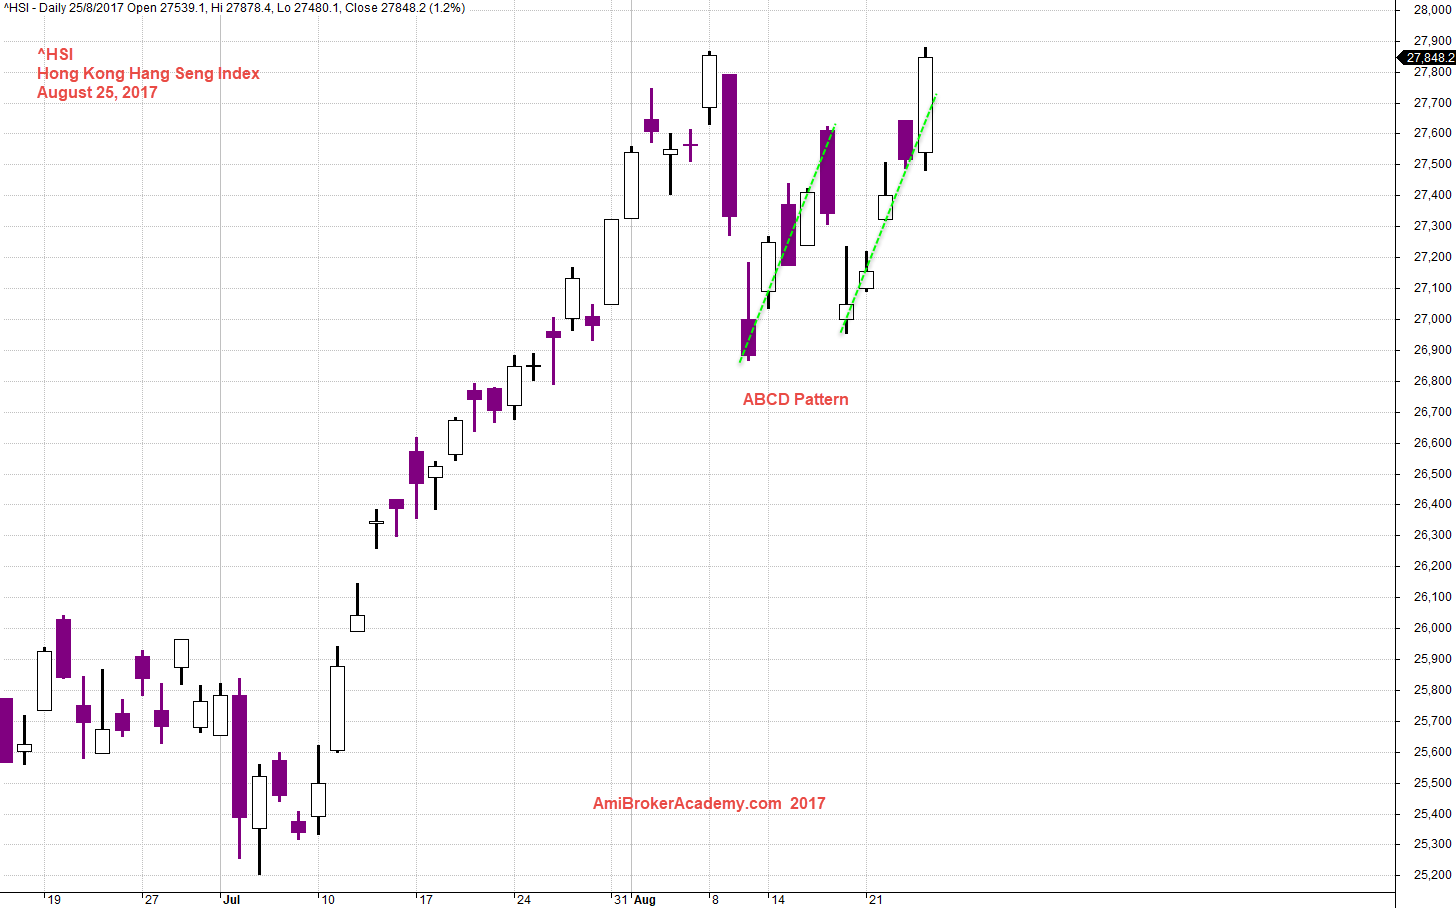
August 25, 2017 Hong Kong Hang Seng Index and ABCD Pattern
Thanks for visit the site here. You could also find free MACD scan here in this site too.
Moses
AmiBrokerAcademy.com
Disclaimer
The above result is for illustration purpose. It is not meant to be used for buy or sell decision. We do not recommend any particular stocks. If particular stocks of such are mentioned, they are meant as demonstration of Amibroker as a powerful charting software and MACD. Amibroker can program to scan the stocks for buy and sell signals.
These are script generated signals. Not all scan results are shown here. The MACD signal should use with price action. Users must understand what MACD and price action are all about before using them. If necessary you should attend a course to learn more on Technical Analysis (TA) and Moving Average Convergence Divergence, MACD.
Once again, the website does not guarantee any results or investment return based on the information and instruction you have read here. It should be used as learning aids only and if you decide to trade real money, all trading decision should be your own.