5 April 2021
Welcome!
Welcome to AmiBroker Academy dot com, amibrokeracademy.com.
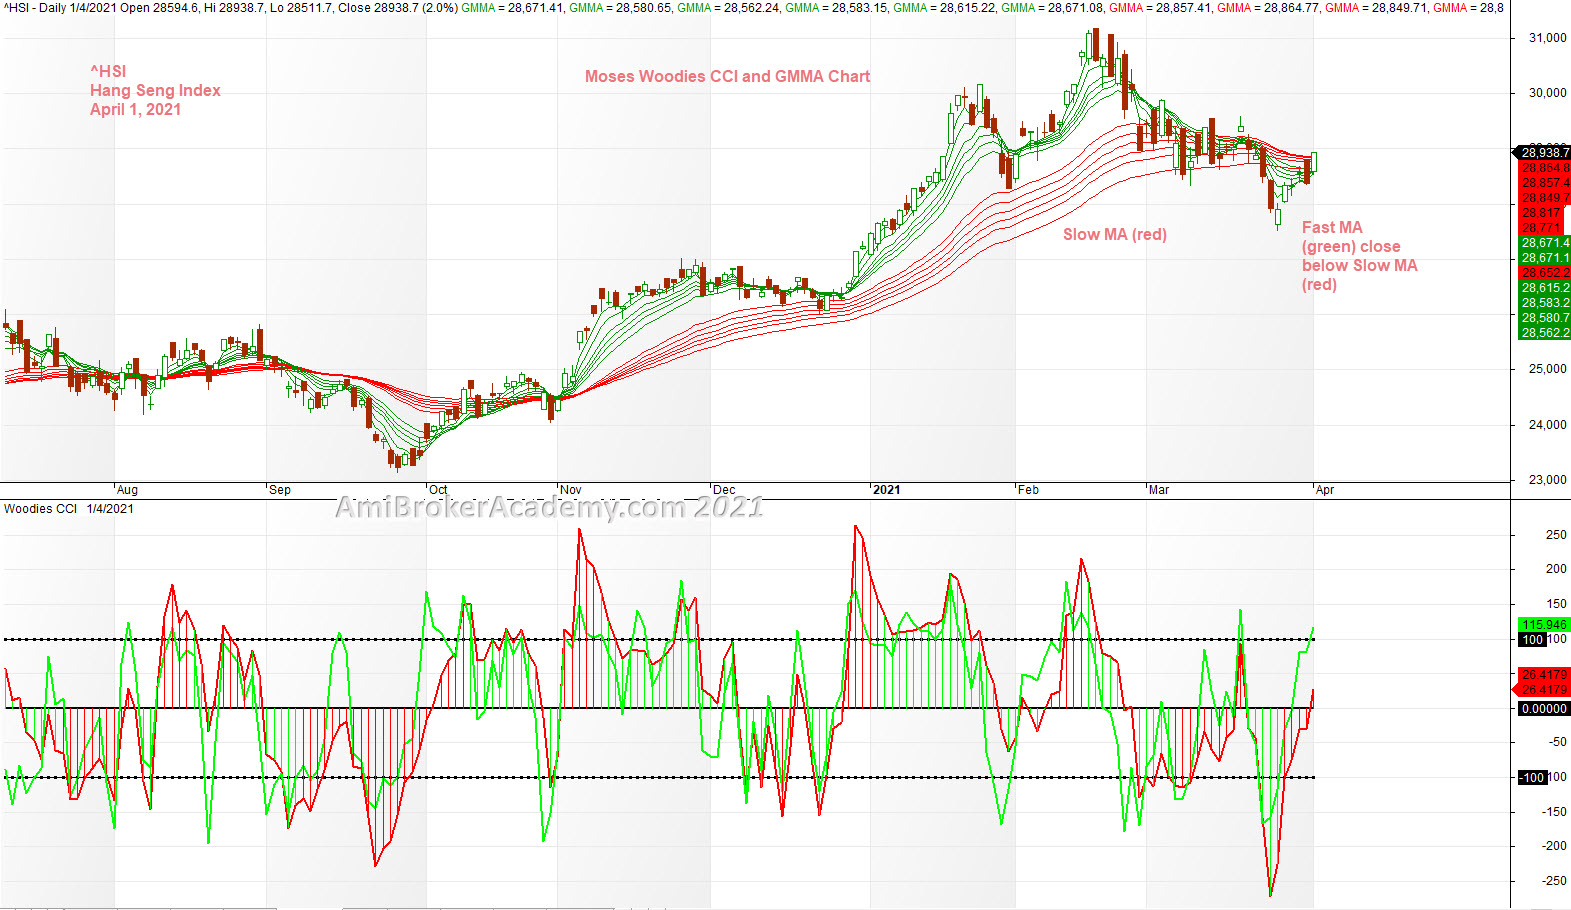
^HSI Hong Kong Hang Seng Index GMMA and Woodies CCI
Study Hang Seng Index using GMMA and Woodies CCI Chart. We could find the price action after close above slow MA (red) and stay above until March. Price Action begin to cross down below Fast MA (green). Fast MA also goes below Slow MA (red).
Besides GMMA, we add the Woodies CCI. Woodies CCI goes below zeroline after February.
If you are not very calm, study the moving averages, like River. Google Rahee Hornor wave theory for move. Have fun!
Moses Free Stock Charting
Free Moses Hang Seng Power Stock Charting
Official AmiBrokerAcademy.com Charting
Disclaimer
The above result is for illustration purpose. It is not meant to be used for buy or sell decision. We do not recommend any particular stocks. If particular stocks of such are mentioned, they are meant as demonstration of Amibroker as a powerful charting software and MACD. Amibroker can program to scan the stocks for buy and sell signals.
These are script generated signals. Not all scan results are shown here. The MACD signal should use with price action. Users must understand what MACD and price action are all about before using them. If necessary you should attend a course to learn more on Technical Analysis (TA) and Moving Average Convergence Divergence, MACD.
Once again, the website does not guarantee any results or investment return based on the information and instruction you have read here. It should be used as learning aids only and if you decide to trade real money, all trading decision should be your own.
We learn from many past and present great traders. Kudo to these master.