August 23, 2017
HPQ Hewlett Packard Charting
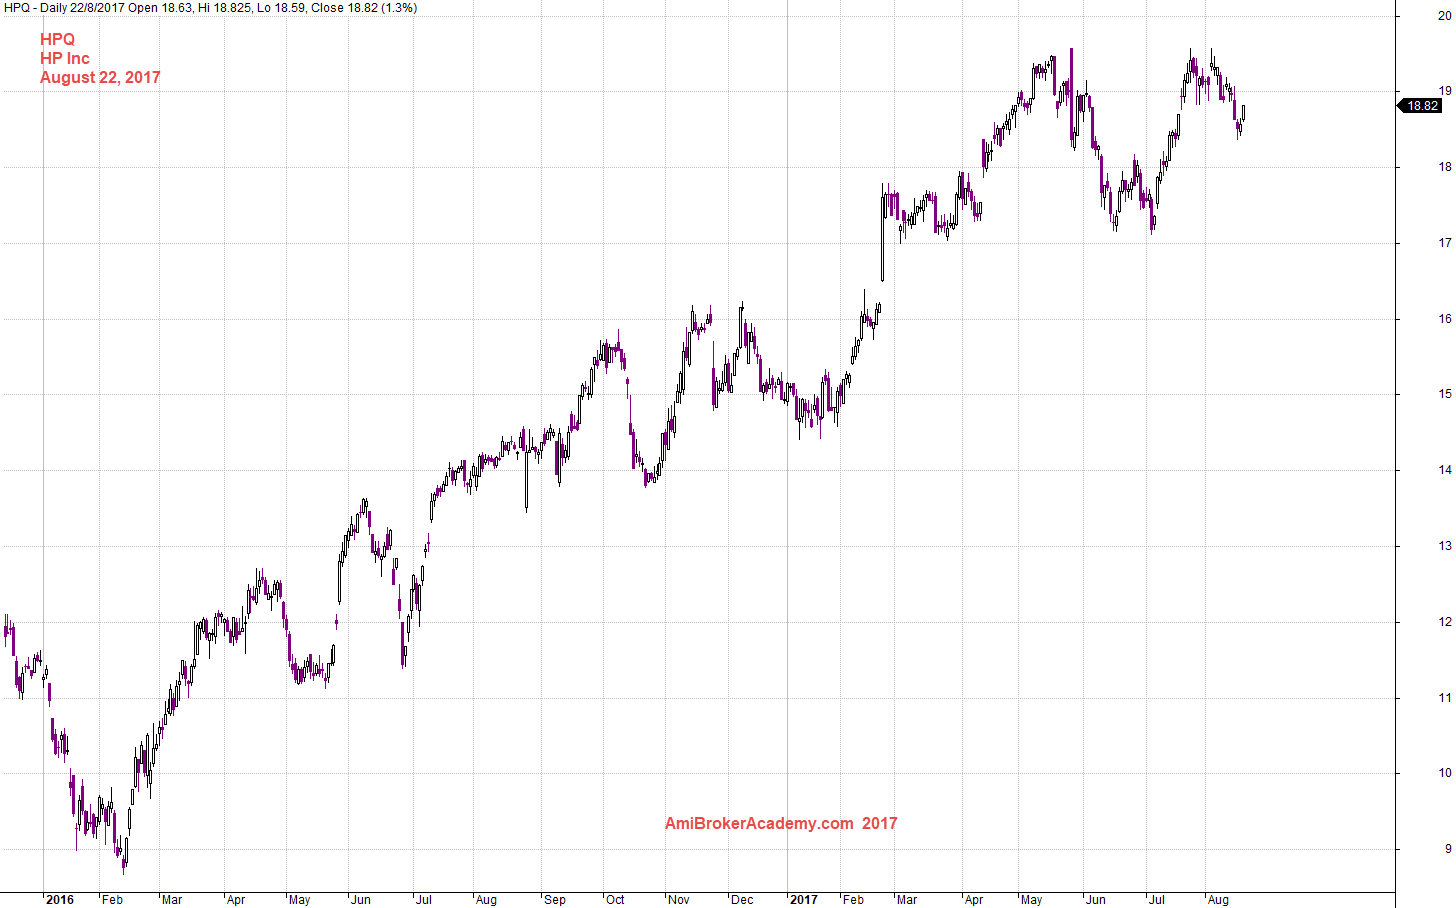
See chart for more, picture worth a thousand words.
Price Action keeps forming higher high and higher low. Bullish trend.
Is the stock reach the topping pattern? May be not, only until the price action breakout below the neckline. There were will fail double top in October 2016. Can you see it? If not never mind, see no eil hear no evil.
August 22, 2017 Hewlett Packard Charting
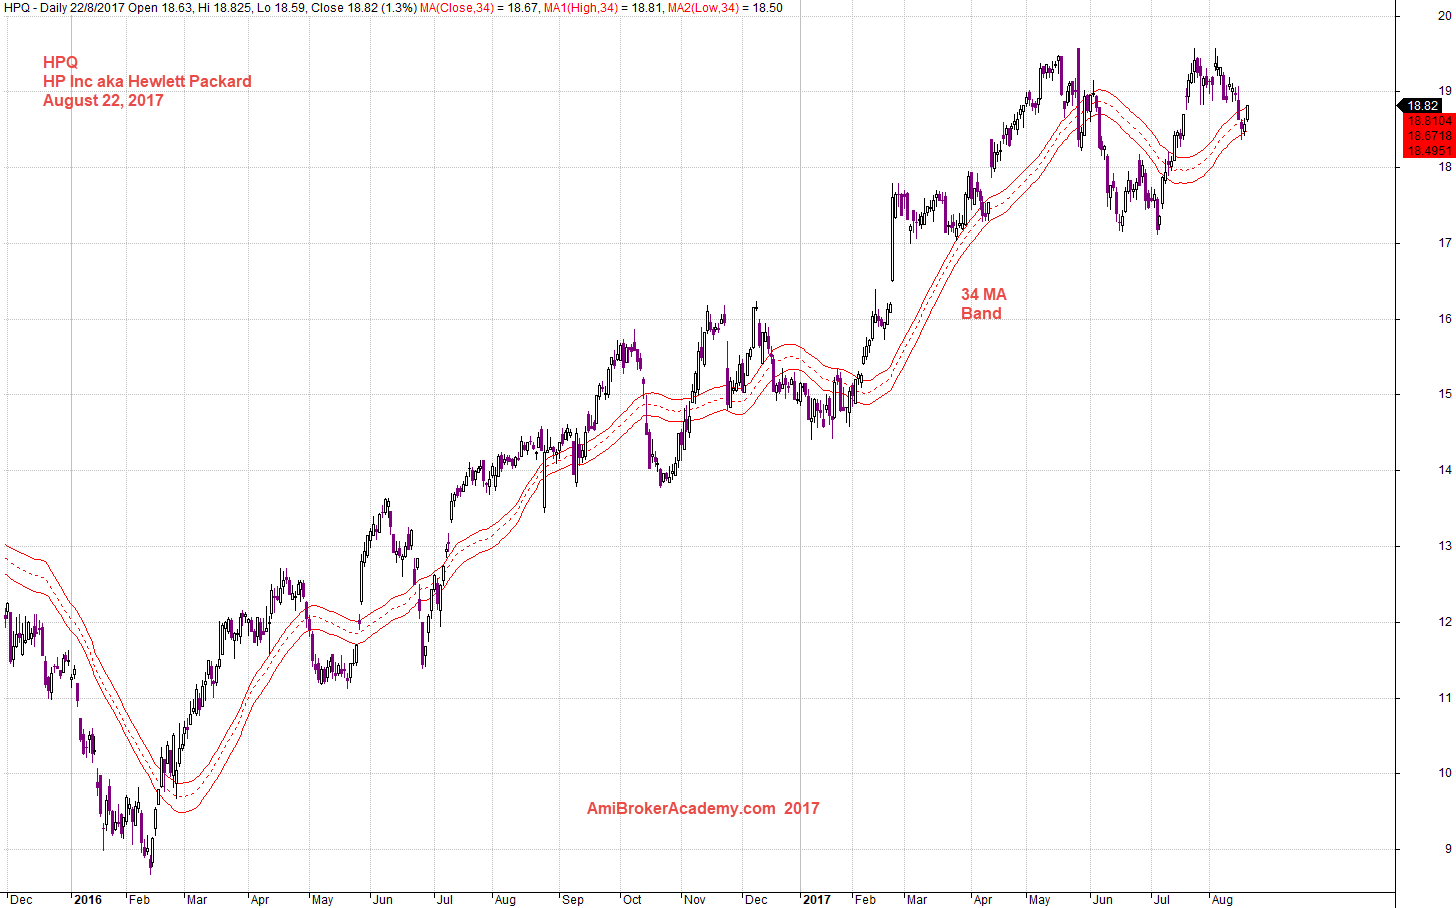
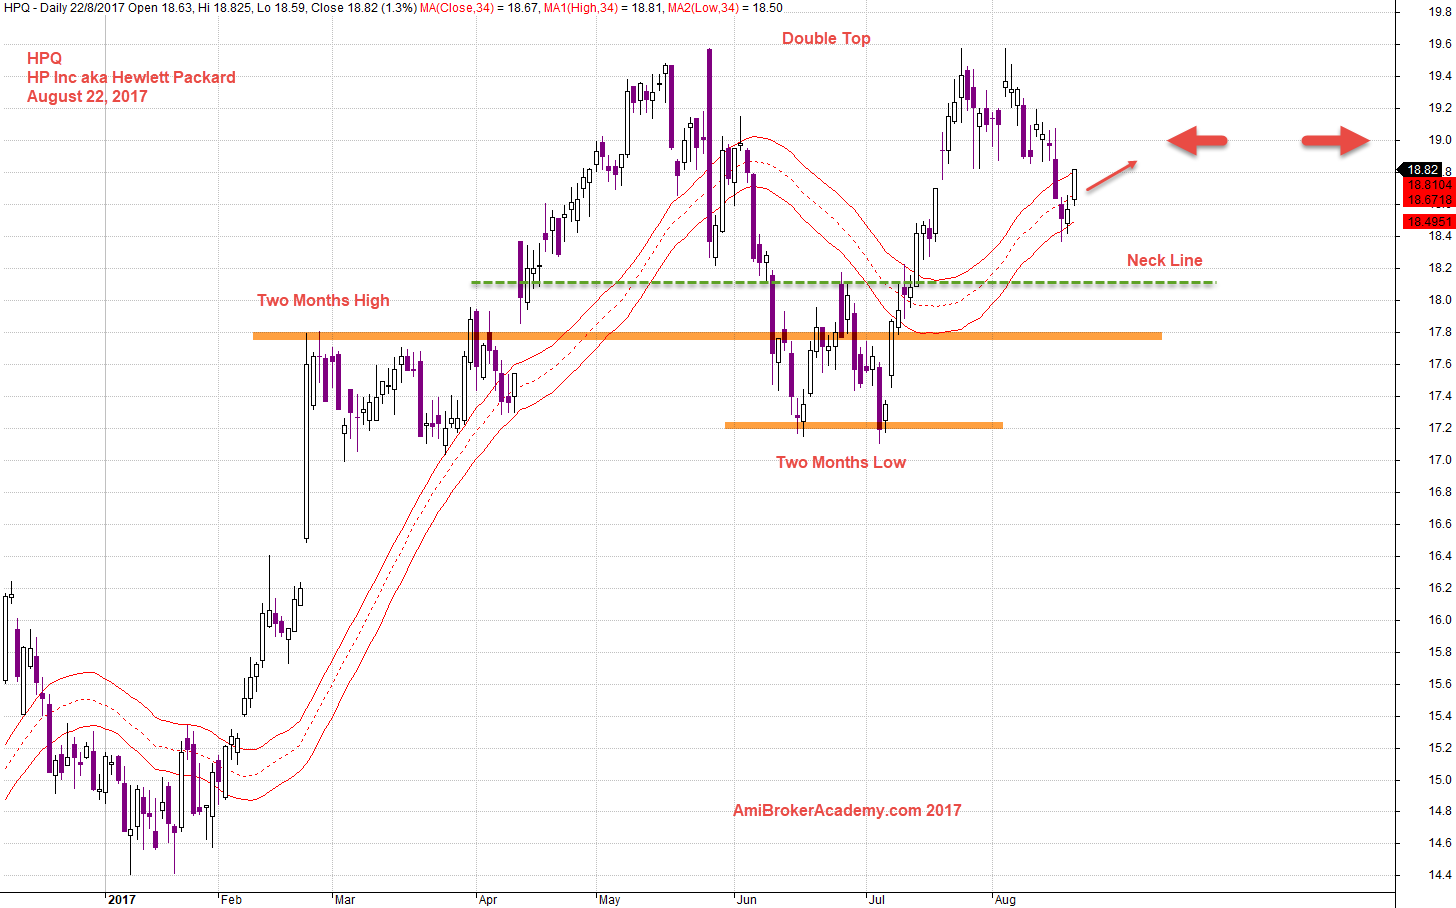
HPQ Hewlett Packard and 34 MA Band
Stock price after crossed up 34 MA Band in 2016, since then the price action struggles to stay above the 34 MA band. The 34 MA band is slopping from bottom left to top right, bullish.
Now, the price action is again at the band, the optimal zone.
We see a possible double top. But only until the neckline has broken and retest, the double top is not consider completed. Let’s watch the stock.
August 22, 2017 Hewlett Packard From 2016 and 34 MA Band
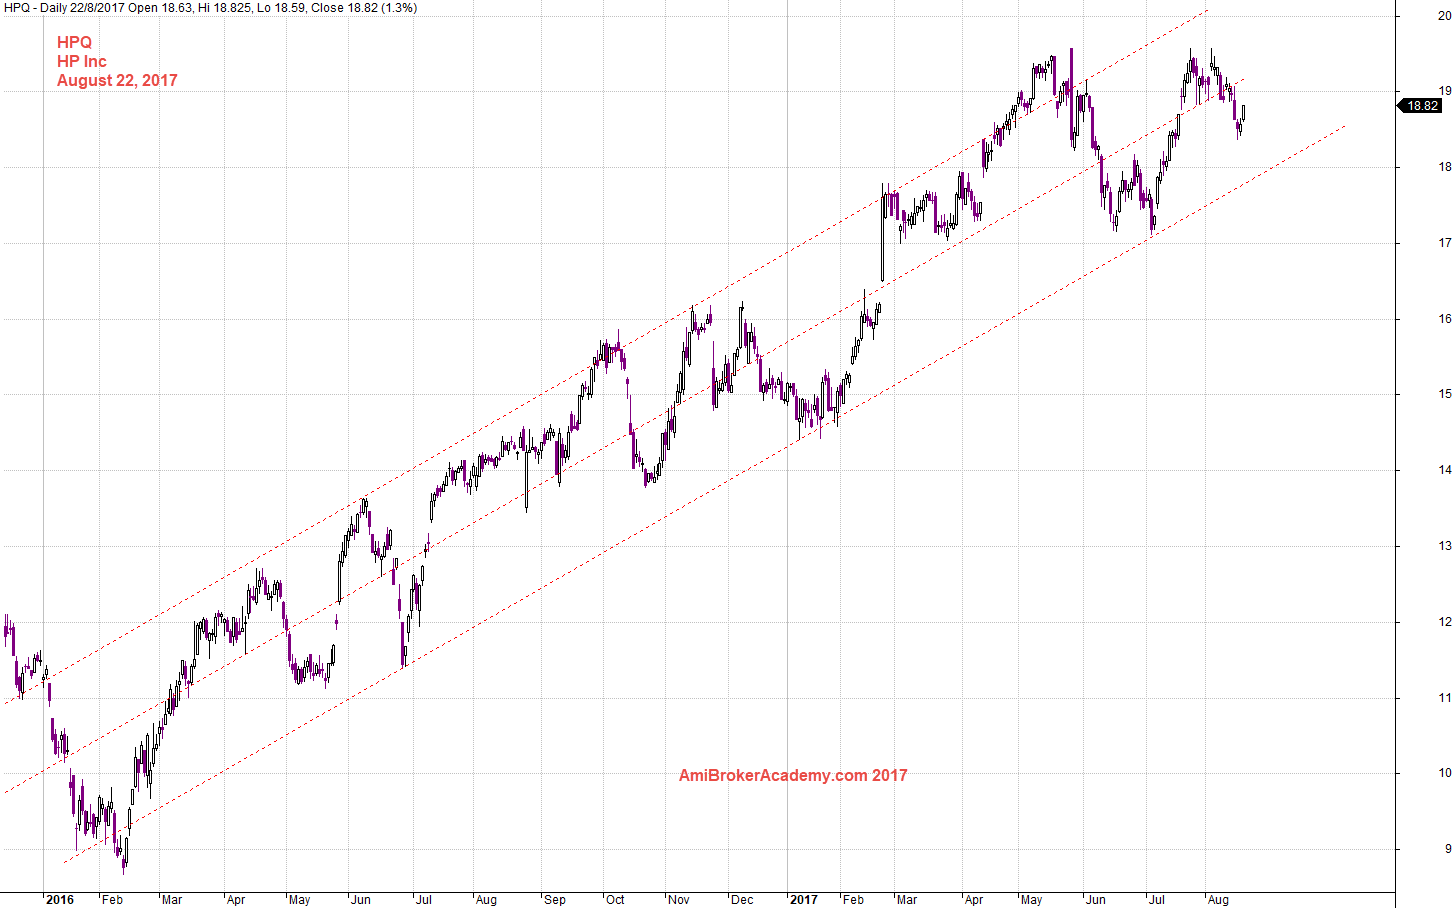
HPQ Hewlett Packard and Channel
Picture worth a thousand words, see chart for more. The price action is trapped withing the channel.
August 22, 2017 Hewlett Packard and Channel
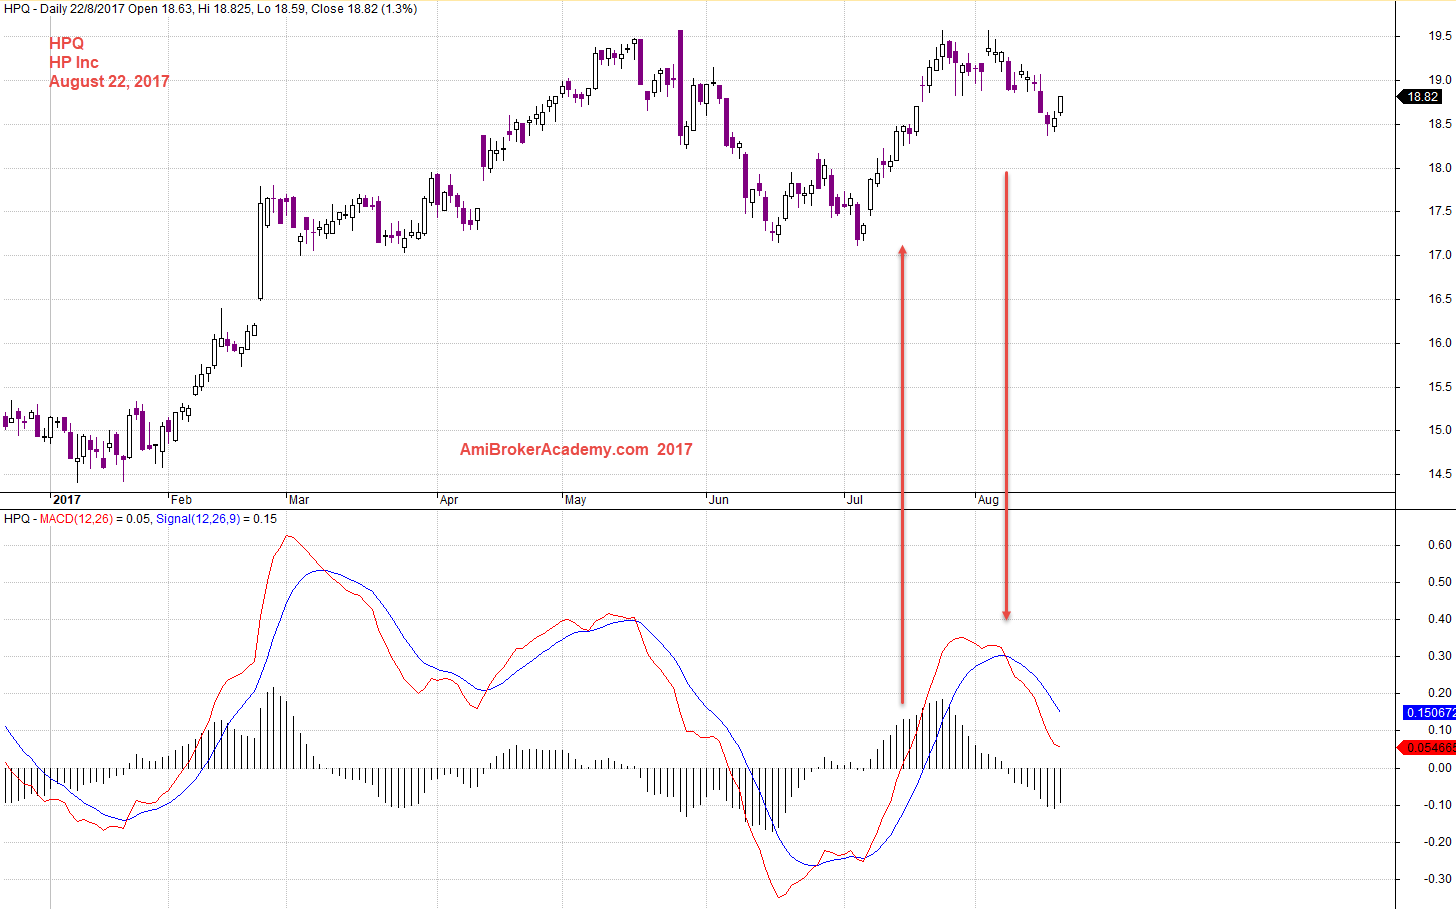
HPQ Hewlett Packard and MACD Signals
See chart, the price action follow the MACD, begin to turn bullish. But the MACD signals become bearish bias again. So, what’s next?
August 22, 2017 Hewlett Packard and MACD signals
HPQ Hewlett Packard and Fibonacci
Picture worth a thousand words. See chart on the price action pullback.
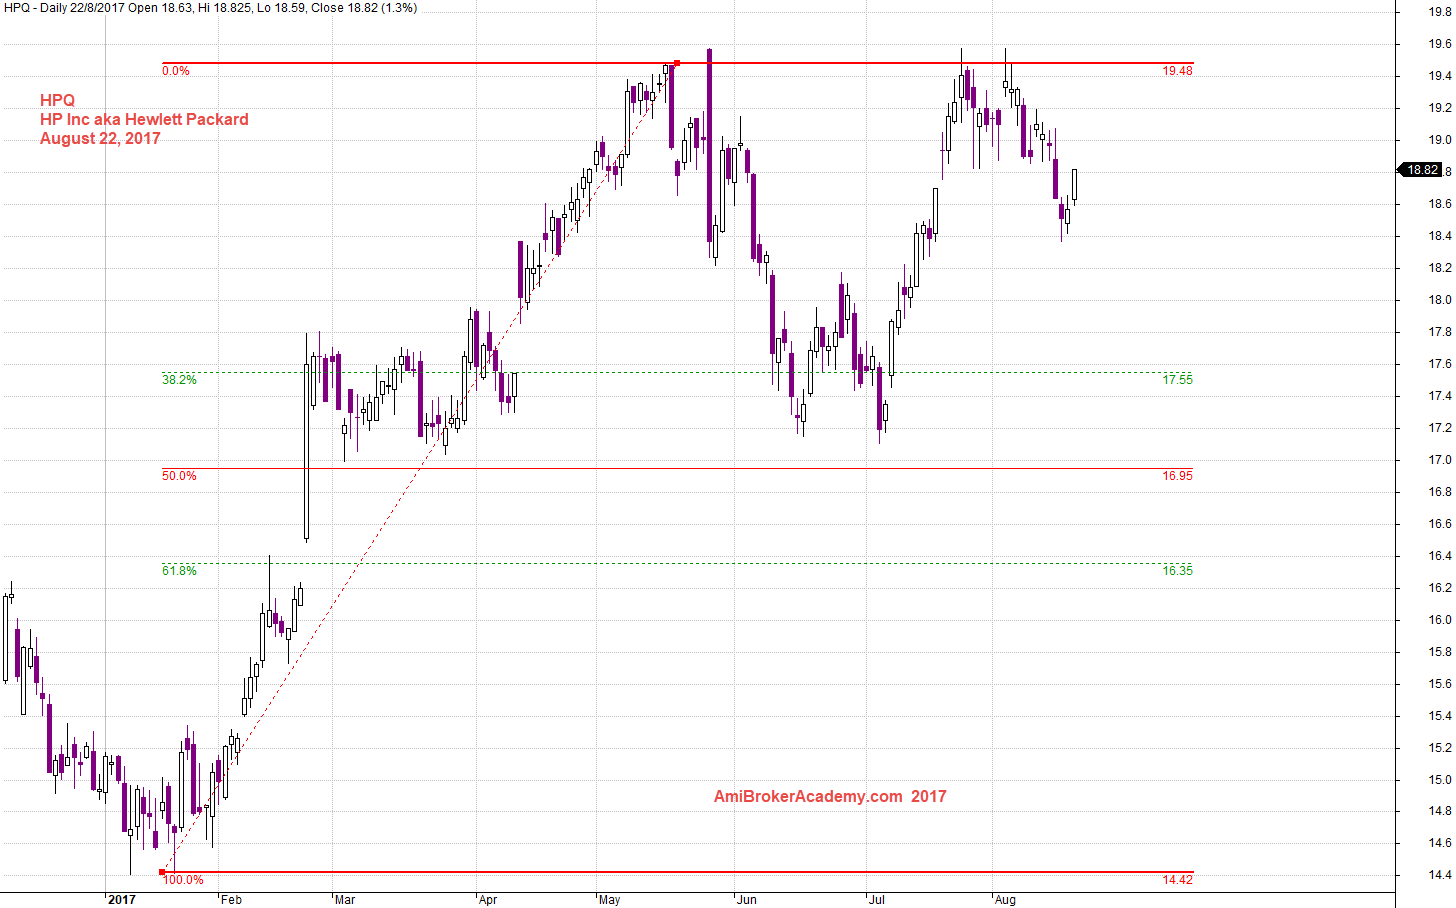
August 22, 2017 Hewlett Packard and Fibonacci
HPQ Hewlett Packard and Key Levels
If you read that far, this is an import chart for your.
Picture worth a thousand words. See chart on the price action pullback. $19 is an important level. Can the price action continue to say above $19. See a few a key levels to track. Have fun!
August 22, 2017 Hewlett Packard and 34 MA Band
Thanks for visit the site here. You could also find free MACD scan here in this site too.
Moses
AmiBrokerAcademy.com
Disclaimer
The above result is for illustration purpose. It is not meant to be used for buy or sell decision. We do not recommend any particular stocks. If particular stocks of such are mentioned, they are meant as demonstration of Amibroker as a powerful charting software and MACD. Amibroker can program to scan the stocks for buy and sell signals.
These are script generated signals. Not all scan results are shown here. The MACD signal should use with price action. Users must understand what MACD and price action are all about before using them. If necessary you should attend a course to learn more on Technical Analysis (TA) and Moving Average Convergence Divergence, MACD.
Once again, the website does not guarantee any results or investment return based on the information and instruction you have read here. It should be used as learning aids only and if you decide to trade real money, all trading decision should be your own.