April 8, 2018
Hong Kong Stock Chart Analysis
^HSI Hong Kong Hang Seng Index and Fibonacci Levels
Manage your risk! Study Hong Kong Hang Seng Index using Fibonacci. You will find interesting information for your to think. First you do a swing low to high reference to low from last last year, 2016 December low to high in 2018. You will find the price action supported at and near 38%.
And you do a swing high to low from 2018 high to low, you see the price action resisted by 61.8%, and resisted twice.
So, the index will continue to be bearish or may rebounce. See our next chart for more.
Powerful Chart Software – AmiBroker
The following chart is produced using AmiBroker charting software. It is a powerful chart software. Anything, finance ticket you could download from Yahoo! Finance you could plot them, those you are interested all in a chart, so you could analyse them.
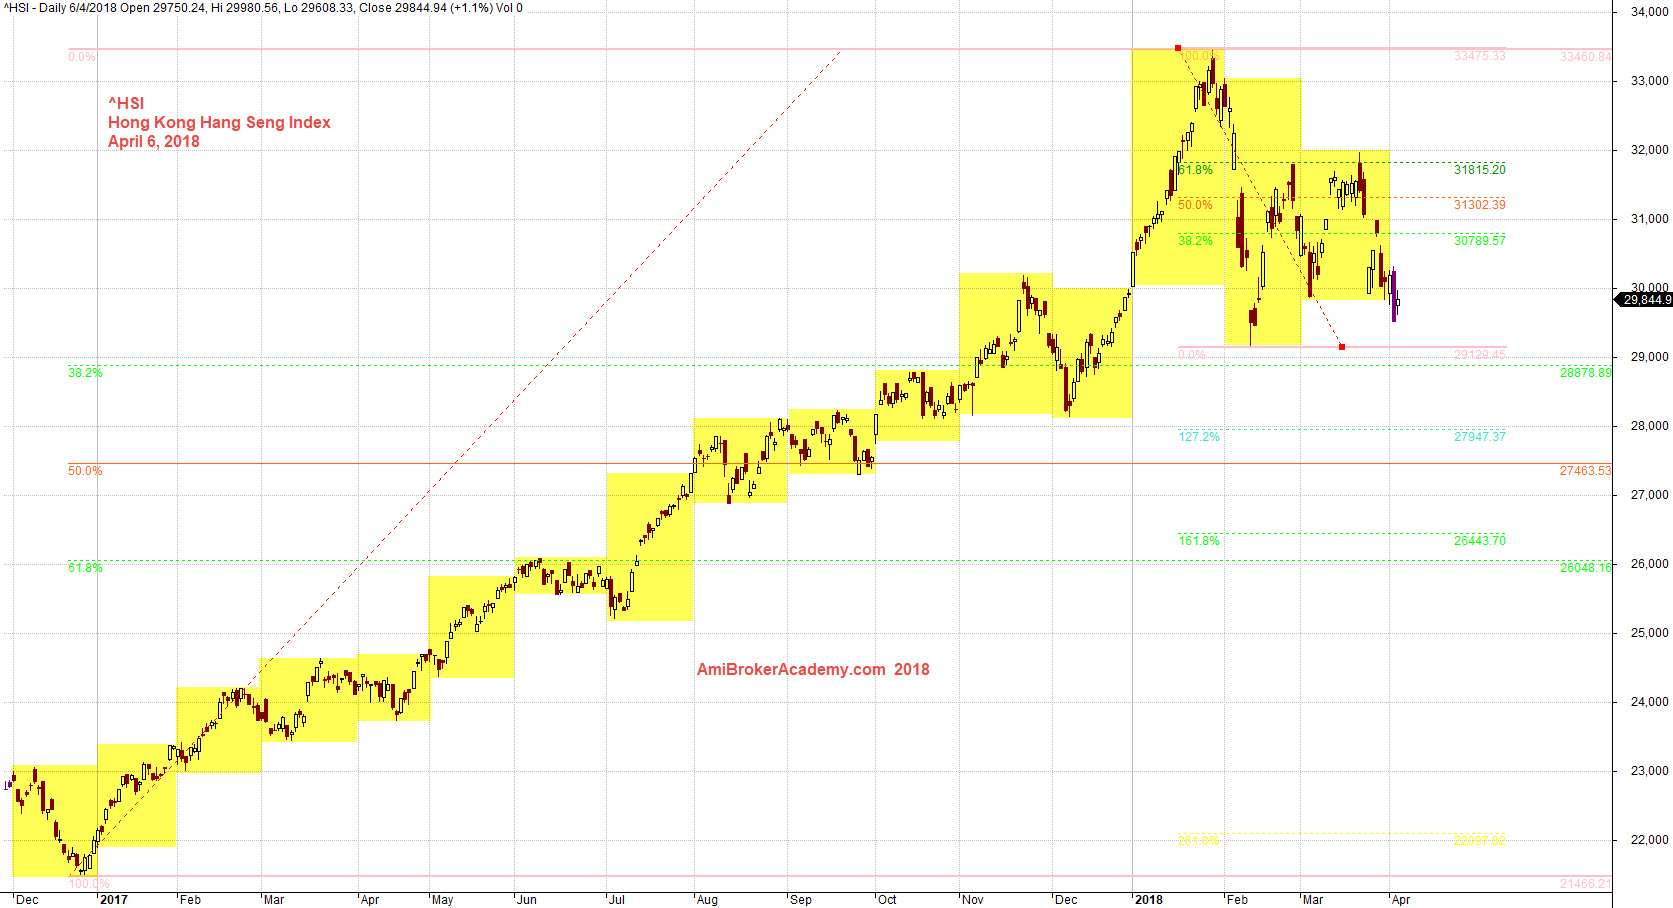
April 6, 2018 Hong Kong Hang Seng Index and Fibonacci Retracement Swing Low to High and High to Low
^HSI Hang Seng Index and Fibonacci Levels and ABCD Pattern
Study the chart, think think got more things, we see a bearish ABCD pattern, picture worth a thousand words, see chart for more. The interesting is the CD leg may be supported by Fibonacci 50%.
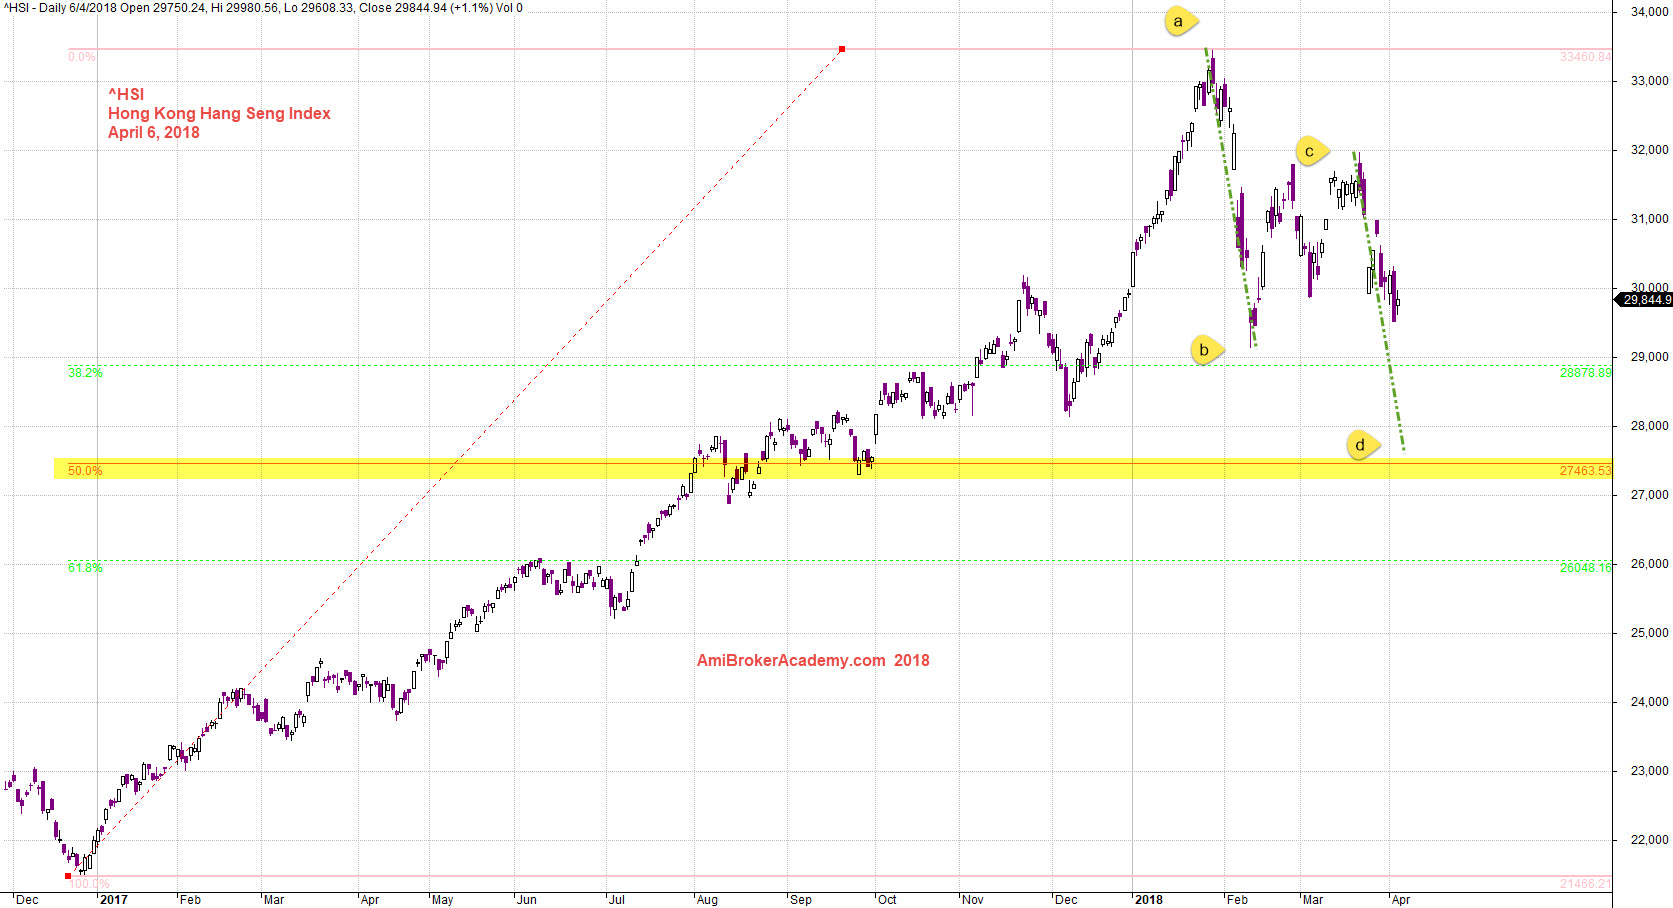
April 6, 2018 Hong Kong Hang Seng Index and Fibo Swing Low to Hing and ABCD
Moses China Stock Chart Analysis
AmiBrokerAcademy.com
Disclaimer
The above result is for illustration purpose. It is not meant to be used for buy or sell decision. We do not recommend any particular stocks. If particular stocks of such are mentioned, they are meant as demonstration of Amibroker as a powerful charting software and MACD. Amibroker can program to scan the stocks for buy and sell signals.
These are script generated signals. Not all scan results are shown here. The MACD signal should use with price action. Users must understand what MACD and price action are all about before using them. If necessary you should attend a course to learn more on Technical Analysis (TA) and Moving Average Convergence Divergence, MACD.
Once again, the website does not guarantee any results or investment return based on the information and instruction you have read here. It should be used as learning aids only and if you decide to trade real money, all trading decision should be your own.