30 September, 2018
Thanks for visiting the site.
Moses Stock Stories – Thinking Out Loud
3333.HK China Evergrande Group 恒大集团 Charting
Study China Evergrade Group 恒大集团 stock from 2017, see chart picture worth a thousand words. We added moving averages, use 34 period, high low and close. The three moving averages form a band, or river. See the price action after the high at 32, the price action begin to move in zigzaq, abcd pattern downward. With River, we could see the bear trend. The river flow downward, the price action hit the low just befor 18 and rebounce up again. But the high can not breakout the last high.
Study China Evergrande Group 恒大集团. See chart, we spot many H M Gartley pattern, ABCD pattern.
Manage Your Risk!
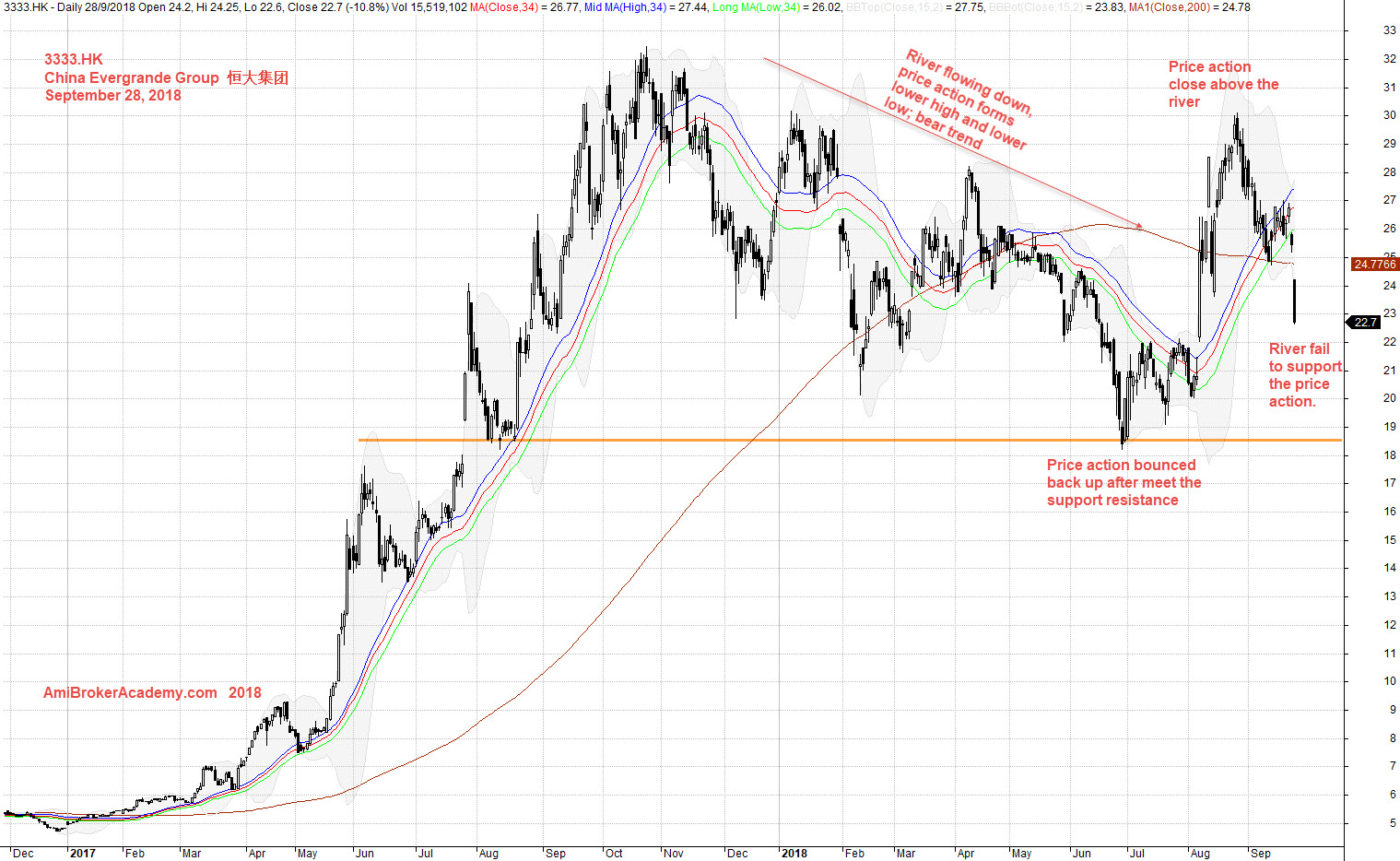
September 28, 2018 China Evergrade Group 恒大集团 and Support Resistance
If you can see the whole chart, “press Ctrl and -” to zoom out to see the entire chart.
Moses
AmiBrokerAcademy.com
Disclaimer
The above result is for illustration purpose. It is not meant to be used for buy or sell decision. We do not recommend any particular stocks. If particular stocks of such are mentioned, they are meant as demonstration of Amibroker as a powerful charting software and MACD. Amibroker can program to scan the stocks for buy and sell signals.
These are script generated signals. Not all scan results are shown here. The MACD signal should use with price action. Users must understand what MACD and price action are all about before using them. If necessary you should attend a course to learn more on Technical Analysis (TA) and Moving Average Convergence Divergence, MACD.
Once again, the website does not guarantee any results or investment return based on the information and instruction you have read here. It should be used as learning aids only and if you decide to trade real money, all trading decision should be your own.