July 15, 2018
Thanks for visiting the site.
About a month back, when ZTE stock began to trade again in Hong Kong Stock Exchange. We saw a free fall of forty percent of the stock price.
ZTE plunges 40% on First Day of Trade
See chart, the last posting.
Hong Kong Stock Analysis
0763.HK ZTE Corporation 中兴通讯 Stock Charting and Sideways
See chart, the price action of ZTE Corporation 中兴通讯 stock. The stock price breakout from the sideways.
We suggested don’t try to catch the falling knife in our last analysis! As we don’t see a bullish pattern when the free fall happened. We see the price action closed above 20 MA. Is it a good time to catch the falling knife. Wait, do you see the bearish ABCD pattern? Manage our risk.
Manage your risk.
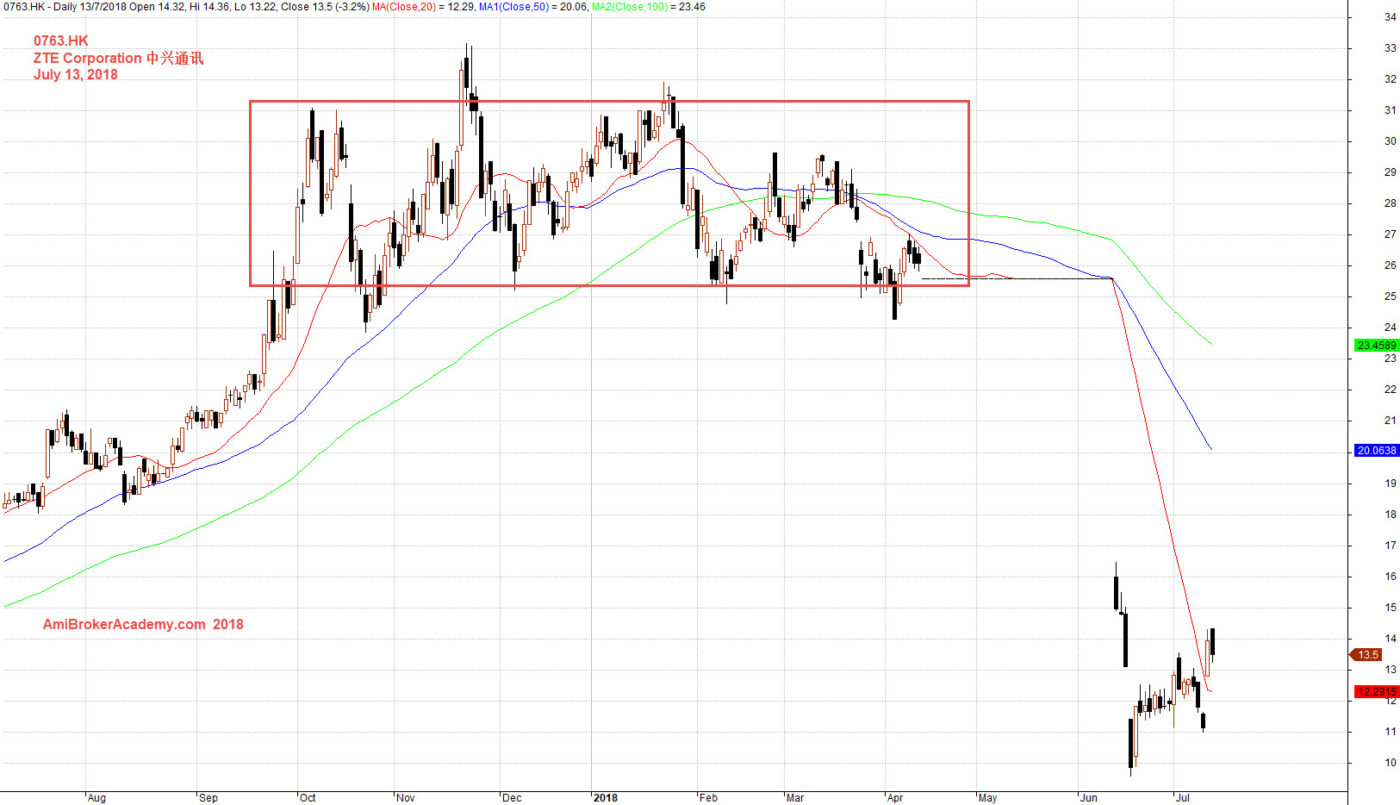
July 13, 2018 ZTE Corporation 中兴通讯 and Sideways
0763.HK ZTE Corporation 中兴通讯 Stock Charting and MACD
See chart for more.
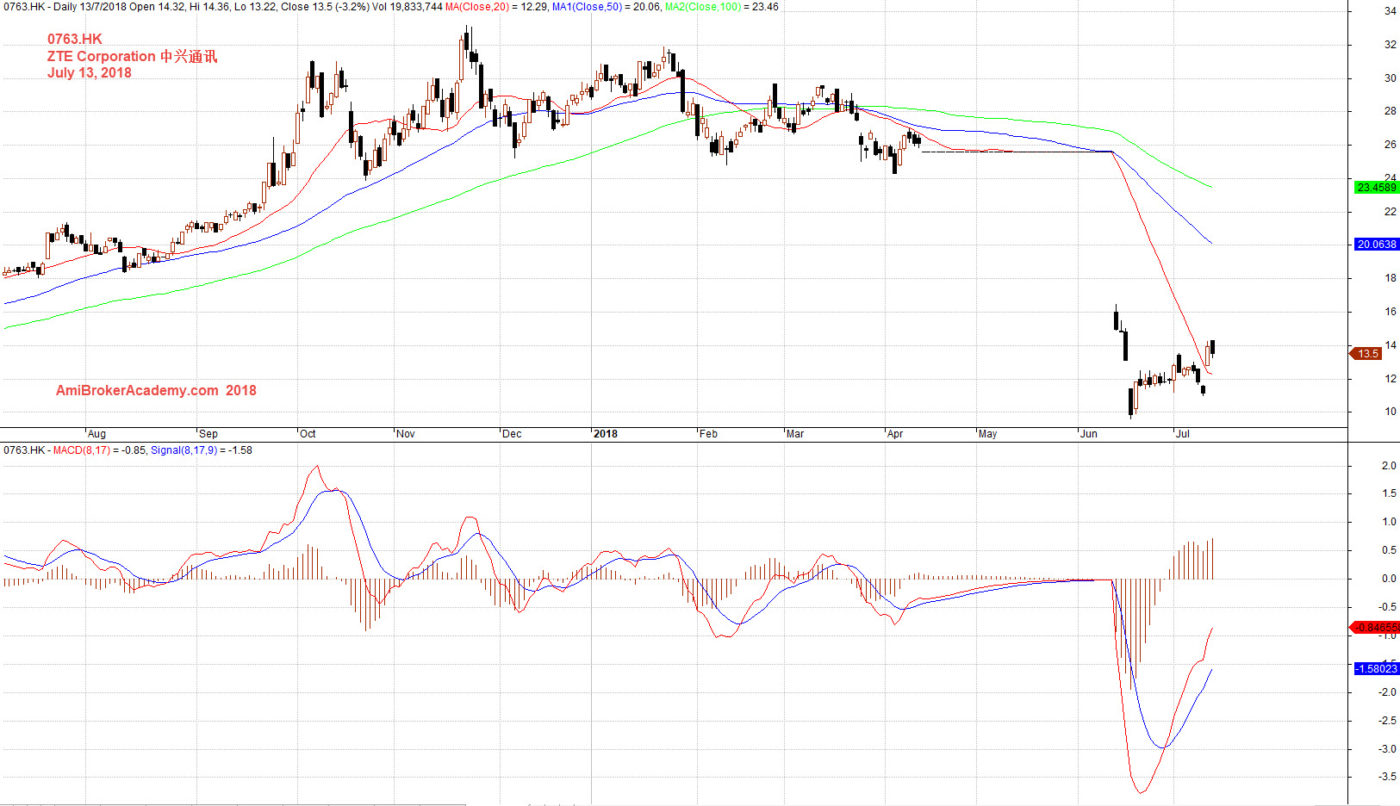
July 13, 2018 ZTE Corporation 中兴通讯 and MACD
Moses
AmiBrokerAcademy.com
Disclaimer
The above result is for illustration purpose. It is not meant to be used for buy or sell decision. We do not recommend any particular stocks. If particular stocks of such are mentioned, they are meant as demonstration of Amibroker as a powerful charting software and MACD. Amibroker can program to scan the stocks for buy and sell signals.
These are script generated signals. Not all scan results are shown here. The MACD signal should use with price action. Users must understand what MACD and price action are all about before using them. If necessary you should attend a course to learn more on Technical Analysis (TA) and Moving Average Convergence Divergence, MACD.
Once again, the website does not guarantee any results or investment return based on the information and instruction you have read here. It should be used as learning aids only and if you decide to trade real money, all trading decision should be your own.