June 5, 2018
Thanks for visiting the site.
Powerful Chart Software – AmiBroker
The following chart is produced using AmiBroker charting software. It is a powerful chart software. You plot the stocks you are interested all in one chart, as long as you still could read them. See chart below.
Hong Kong Stock Analysis
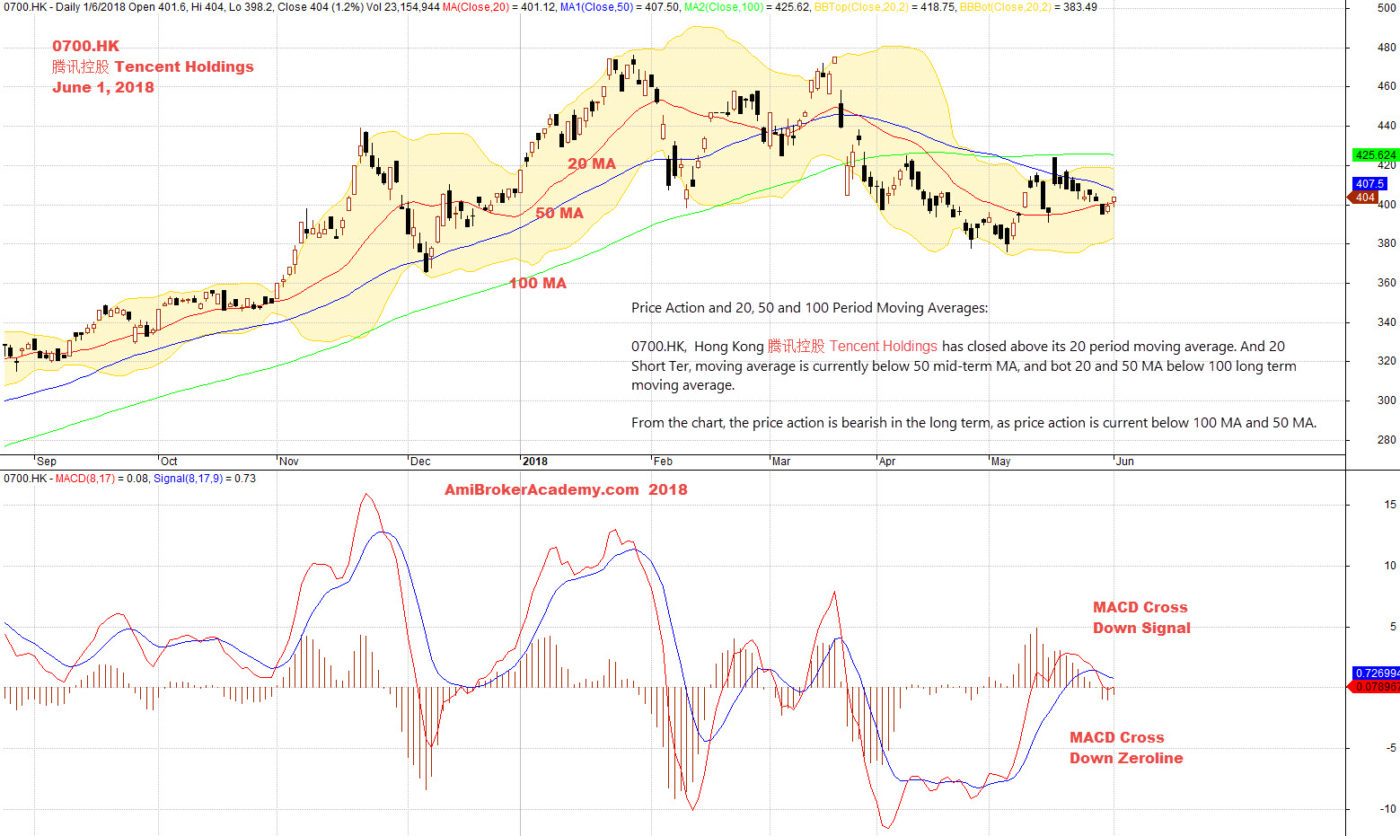
0700.HK Hong Kong Tencent Holdings 腾讯控股 Charting
See chart, the price action of Hong Kong Tencent Holdings 腾讯控股 stock. We like to use MACD indicator. We see MACD cross down signal, MACD cross down zeroline, these are bearish signs. Besides that we also see the price action is forming lower high, and price action is below 50 and 100 MA. Trade with your eyes open. Manage your risk.
June 1, 2018 Tencent Holdings 腾讯控股 and MACD
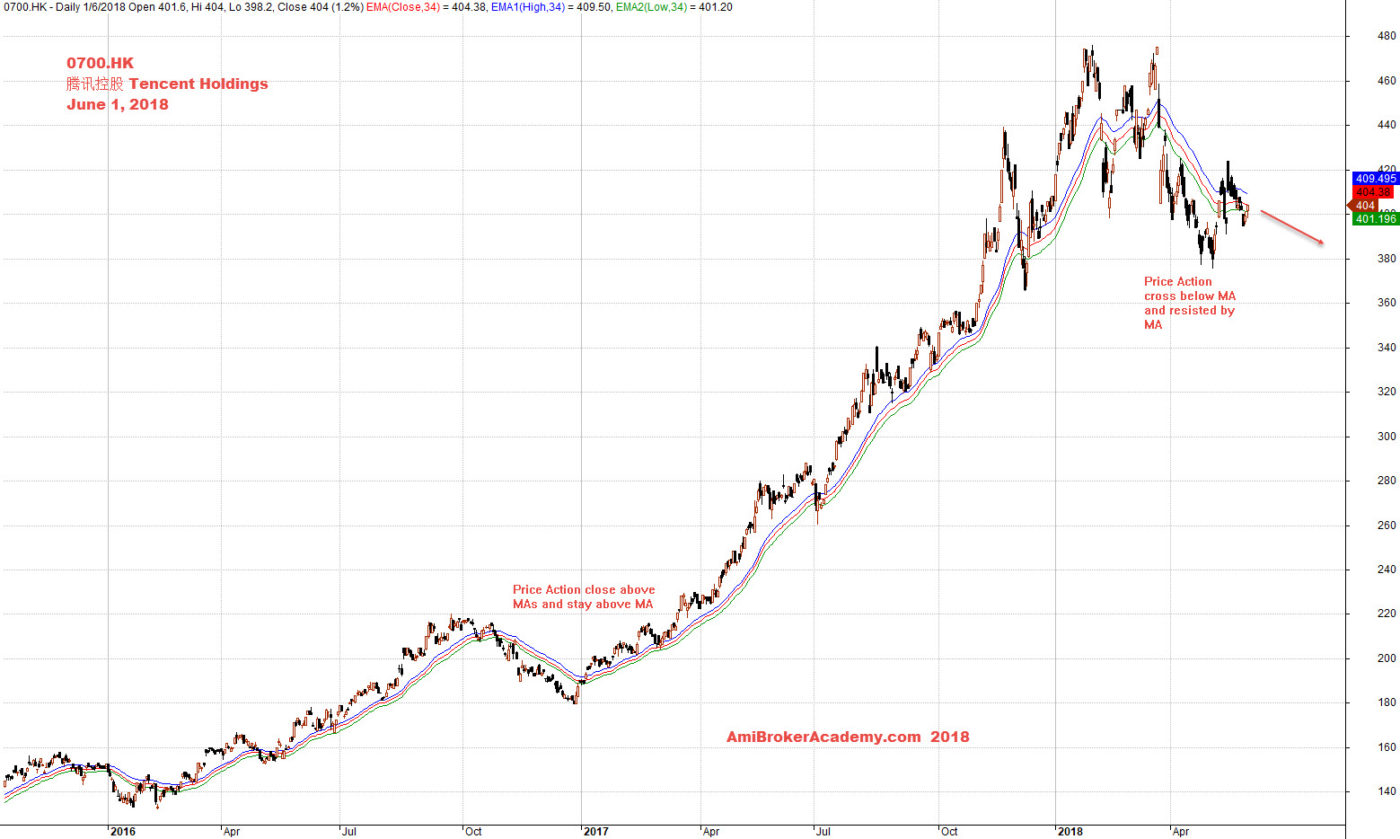
Tencent Holdings 腾讯控股 Charting
Study Tencent Holdings 腾讯控股 stock from a different tool, MA Wave. We use three moving averages, high low and close of 34 period. The three MAs form a band, or wave. We see the price action has finally close below MA wave and get resisted by MA wave. We also see the MA wave is point down. Bearish. Manage your risk.
June 1, 2018 Tencent Holdings 腾讯控股 and MA Wave
Support Resistance – Tencent Holdings 腾讯控股 Charting
Picture worth a thousand words, see chart. We see price action has closed below three months support. See chart, now the April and May month low is lower than January, February and March month low. Only until the price actionclose above the January, February, and March low, do not buy. Only buy support. Trade with eyes open. Manage your risk.

June 1, 2018 Tencent Holdings 腾讯控股 and Support Resistance or Month High Low
Moses
AmiBrokerAcademy.com
Disclaimer
The above result is for illustration purpose. It is not meant to be used for buy or sell decision. We do not recommend any particular stocks. If particular stocks of such are mentioned, they are meant as demonstration of Amibroker as a powerful charting software and MACD. Amibroker can program to scan the stocks for buy and sell signals.
These are script generated signals. Not all scan results are shown here. The MACD signal should use with price action. Users must understand what MACD and price action are all about before using them. If necessary you should attend a course to learn more on Technical Analysis (TA) and Moving Average Convergence Divergence, MACD.
Once again, the website does not guarantee any results or investment return based on the information and instruction you have read here. It should be used as learning aids only and if you decide to trade real money, all trading decision should be your own.