19 September, 2018
Thanks for visiting the site.
Moses Stock Stories – Thinking Out Loud
3333.HK China Evergrande Group 恒大集团 Charting
Image you bought China Evergrande Group 恒大集团 stock as early as 2010, and you did not sell the stock. You will probably be very happy now. Remember the rule of technical analysis, start taking profit when the price action breakout below the bull trendline.
Study China Evergrande Group 恒大集团. See chart, we spot many H M Gartley pattern, ABCD pattern. Within a big ABCD pattern, there are many smaller ABCD pattern.
Manage Your Risk!

September 19, 2018 China Evergrande Group 恒大集团 from 2010
If you can see the whole chart, “press Ctrl and -” to zoom out to see the entire chart.
Zoom in, and add an indicator like MACD. What can you trade using MACD signal? See chart, picture worth a thousand words. Manage your risk.
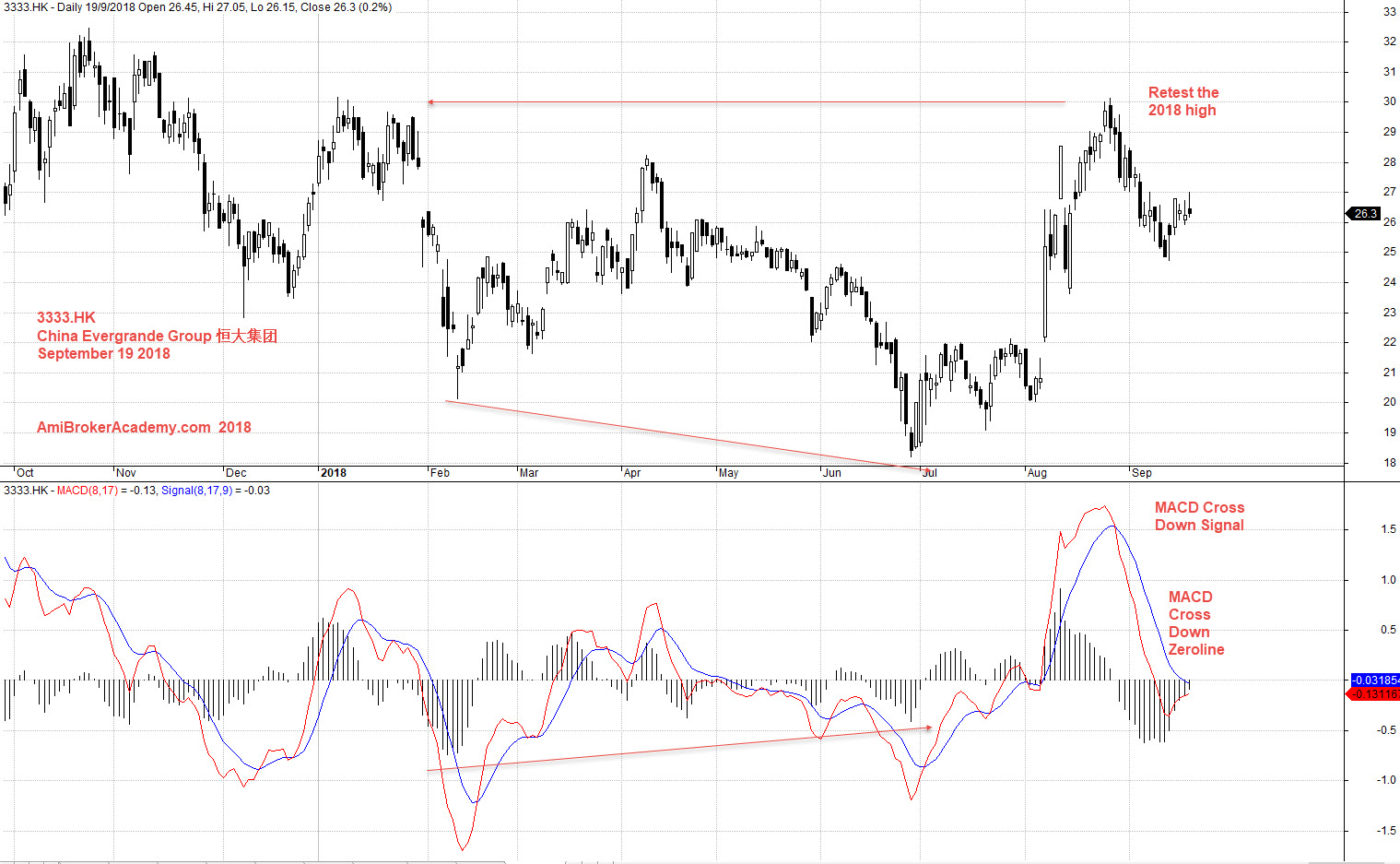
September 19, 2018 China Evergrande Group 恒大集团 and MACD
Moses
AmiBrokerAcademy.com
Disclaimer
The above result is for illustration purpose. It is not meant to be used for buy or sell decision. We do not recommend any particular stocks. If particular stocks of such are mentioned, they are meant as demonstration of Amibroker as a powerful charting software and MACD. Amibroker can program to scan the stocks for buy and sell signals.
These are script generated signals. Not all scan results are shown here. The MACD signal should use with price action. Users must understand what MACD and price action are all about before using them. If necessary you should attend a course to learn more on Technical Analysis (TA) and Moving Average Convergence Divergence, MACD.
Once again, the website does not guarantee any results or investment return based on the information and instruction you have read here. It should be used as learning aids only and if you decide to trade real money, all trading decision should be your own.