28 June 2021
Welcome!
Welcome to AmiBroker Academy dot com, amibrokeracademy.com.
We will use 1) Ichimoku Cloud, 2) Support Resistance (using box), 3) River (moving average), 4) GMMA and Woodies CCI, 5) Bollinger Bands and Moving Averages, and 6) MACD to analyze the stock chart. See your reading of price action.
We read what the price action tell us, ie Picture worth thousand words meaning.
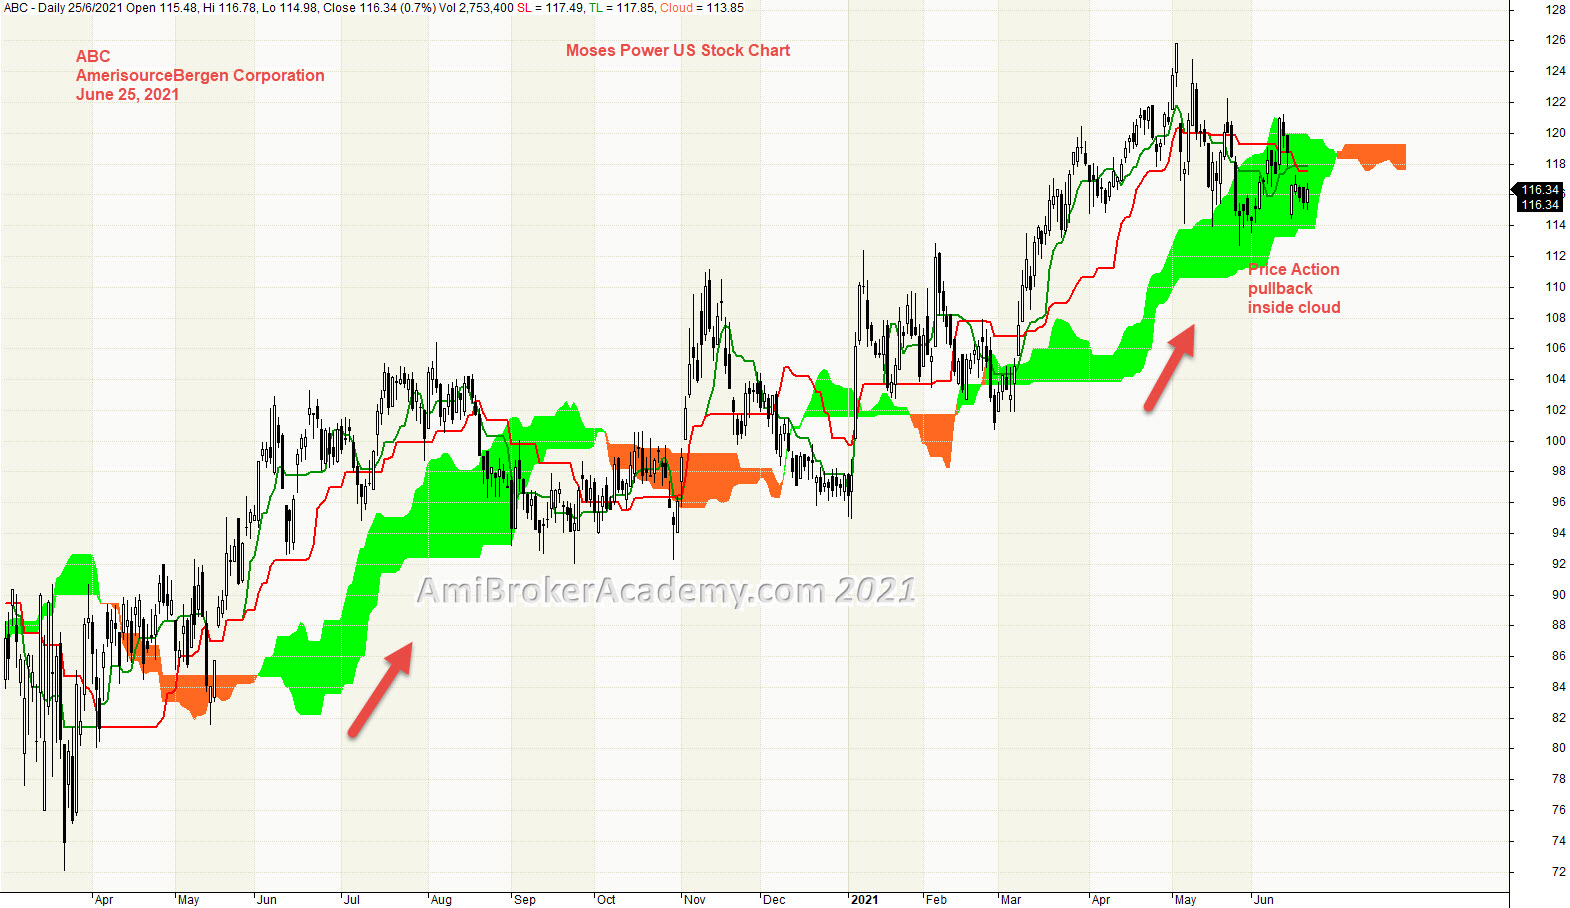
1) ABC | AmerisourceBergen Corporation and Ichimoku Cloud
Ichimoku Cloud is a trend following strategy tool. We see the Tenkan Sen cross under Kijun Sen, a potential for price action goes lower, ie bear trend. But, Tenkan Sen cross above Kijun Sen again, so the bear trend reverse.
Ichimoku Cloud is a multi-dimensional indicator designed to offer support and resistance levels, trending, and entry and exit points. We would want to trade when the price action is clearly above or below cloud, otherwise let stand aside and wait. Wait for a clear picture.
Trade what you see.
Manage risk is a key in trading.
Moses Free Charting
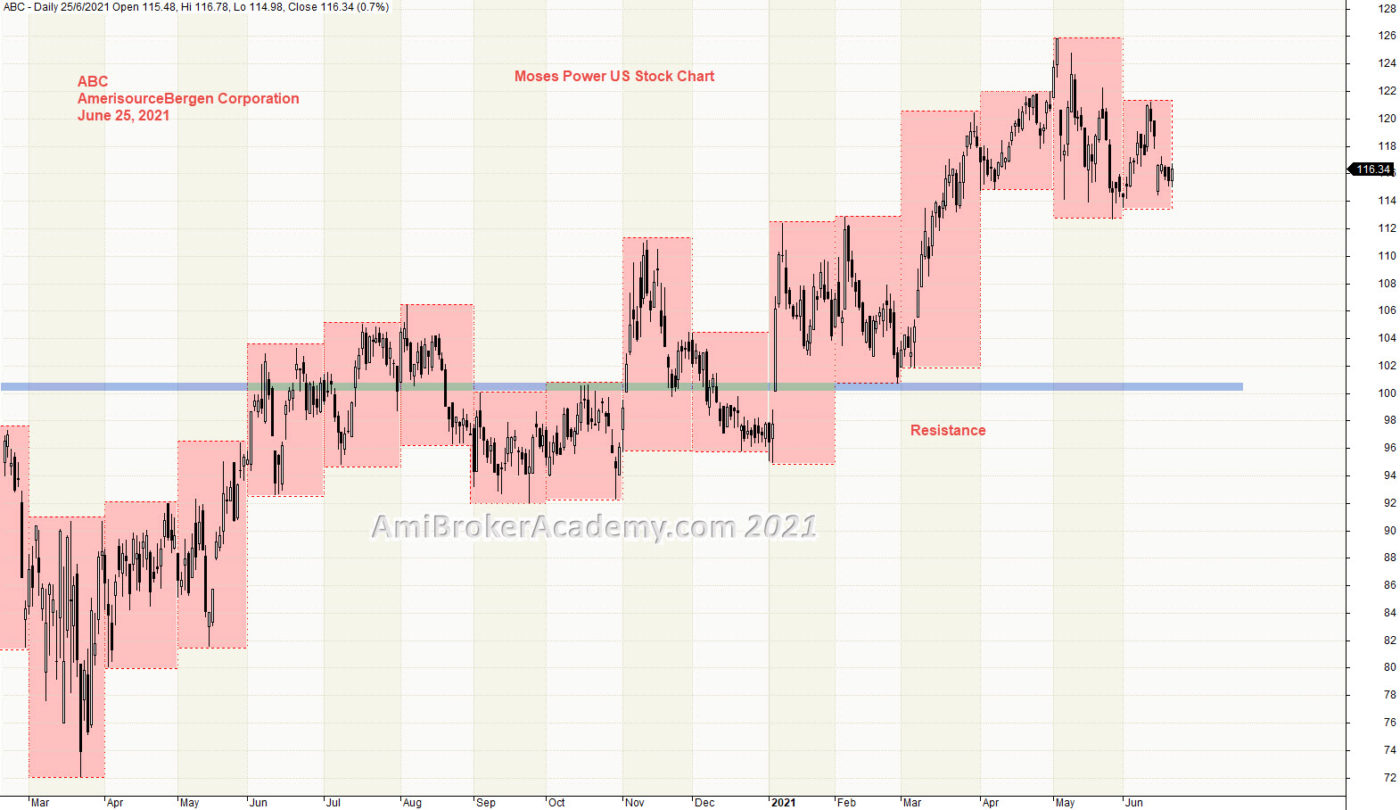
2) AmerisourceBergen Corporation and Support Resistance
Price Action cross up from below to high, price action breakout above resistance. Price Action moves from bottom left to top right, bull trend visually.
We use box to box month high low to see the major level. See chart. 100 Dollars is a major level to watch. Price Action has tested 125 dollars and fail. June month is less volatile compare to last month.
Trade what you see. Buy support and sell resistance. Manage your risk.
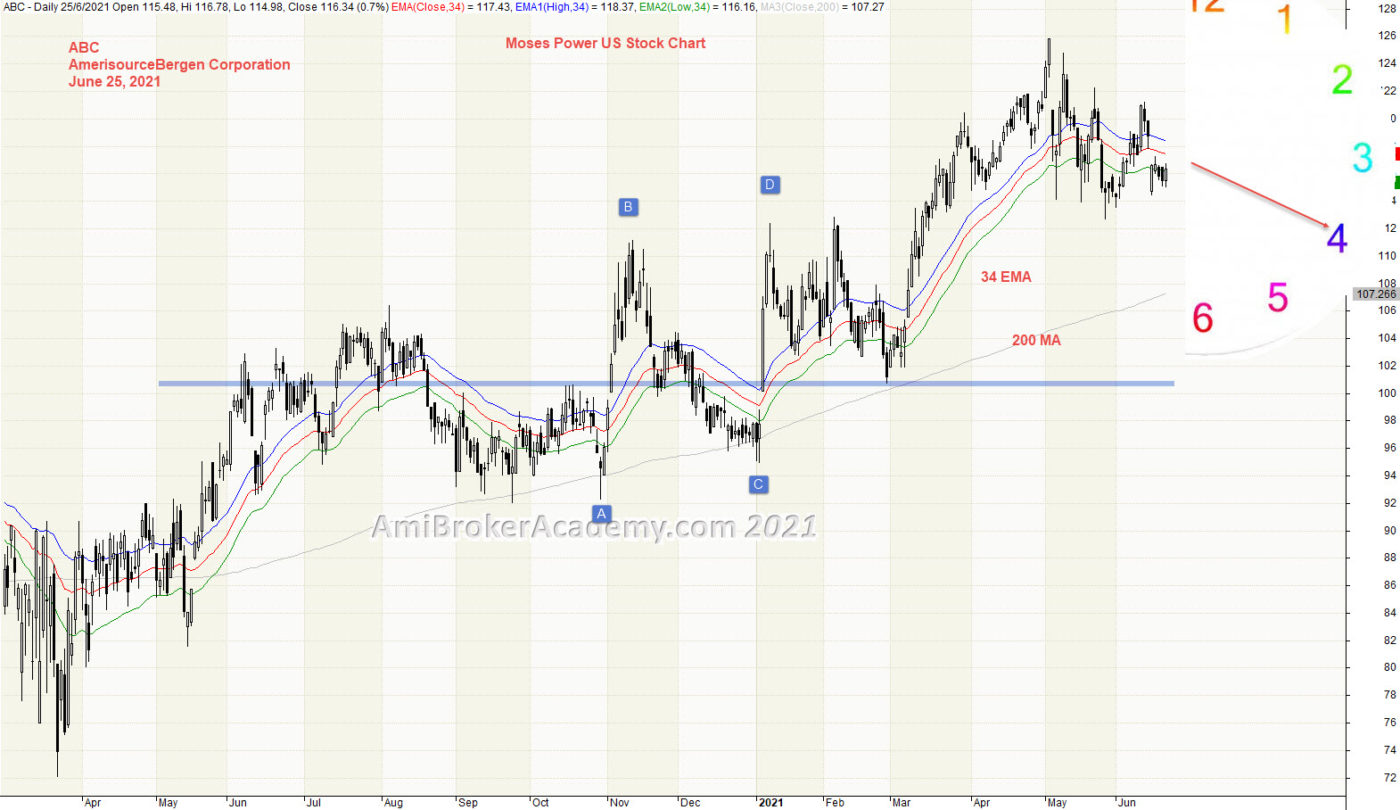
3) AmerisourceBergen Corporation and River
Moving Average is a great visual tool. Raghee uses high, low and close 34 EMA to form a band to determine the wave direction. When price action is currently zipping up and down of 34 EMA and 34 EMA slopping down, bear trend? Trade what you see.
Trend seems still remain strong although the River is begin to slop down, (34 EMA) and 200 MA are still apart. 200 MA remain in slopping up. 34 EMA has been rejected by 200 MA a few times.
Manage your risk.
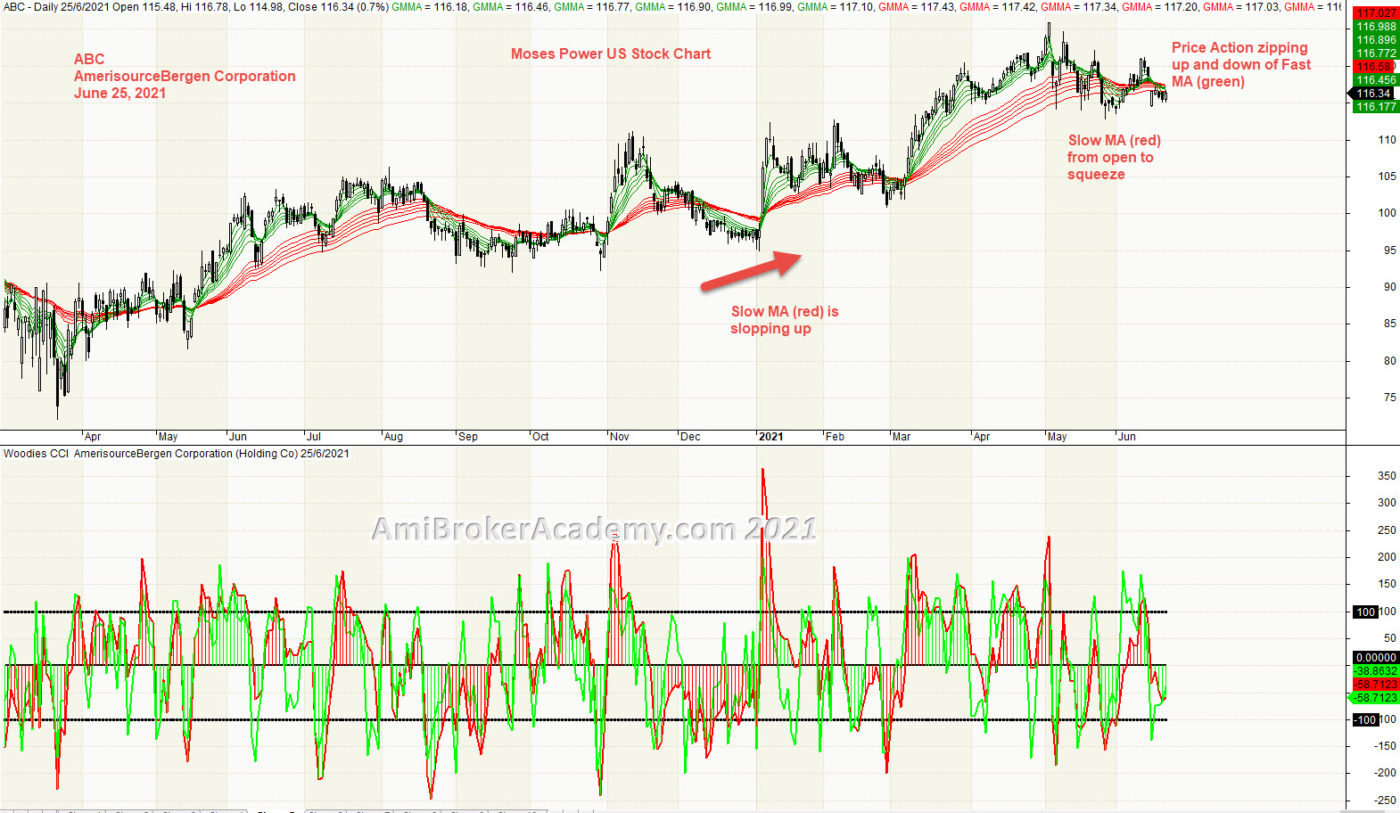
4) AmerisourceBergen Corporation and GMMA and Woodies CCI
Price Action Zipping up and down of Fast MA (green and supported by Slow MA. Can the price action below Slow MA (red)? Will see. Trade with eyes open.
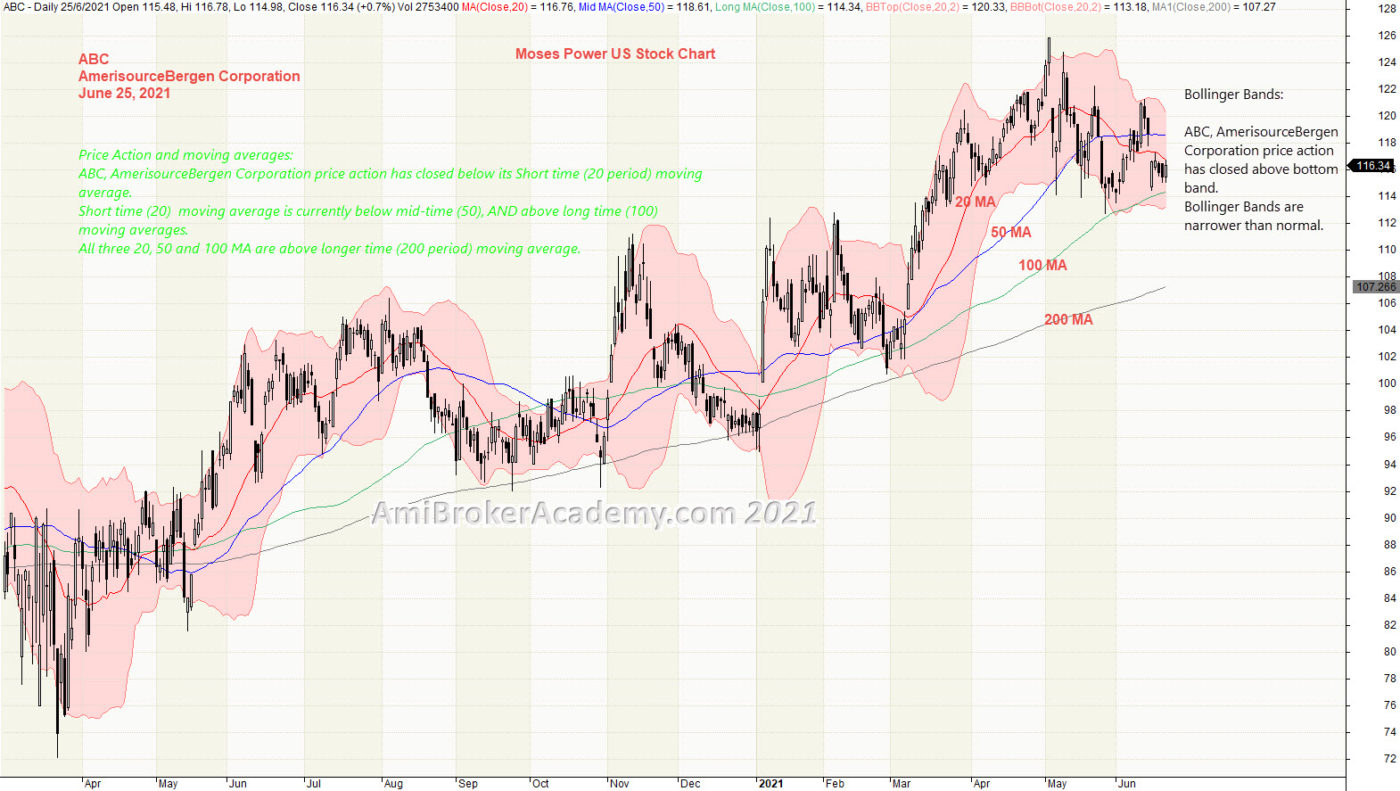
5) AmerisourceBergen Corporation and Bollinger Bands and Moving Averages
Price Action and moving averages:
ABC, AmerisourceBergen Corporation price action has closed below its Short time (20 period) moving average.
Short time (20) moving average is currently below mid-time (50), AND above long time (100) moving averages.
All three 20, 50 and 100 MA are above longer time (200 period) moving average.
Bollinger Bands:
ABC, AmerisourceBergen Corporation price action has closed above bottom band.
Bollinger Bands are narrower than normal.
Bollinger Bands moves from left bottom to top right. Hitting the ceiling.
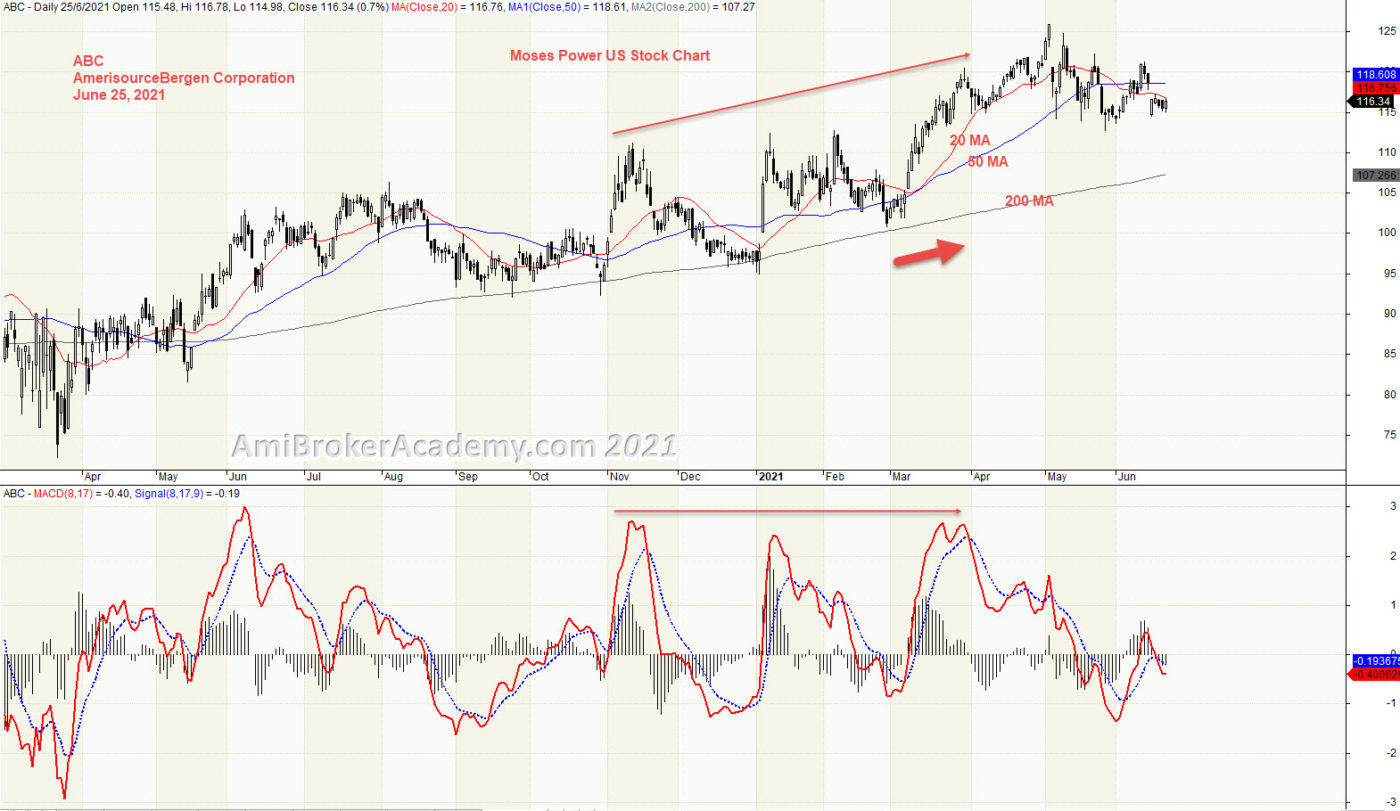
6) AmerisourceBergen Corporation and MACD
We see a price action going higher, but the MACD near flat. MACD Divergence. If the price action follow the the MACD Divergence strategy, the price action will breakout below the support. Trade with what you see. Manage your risk.
Moses Power Charting
Official AmiBrokerAcademy.com Charting
Disclaimer
The above result is for illustration purpose. It is not meant to be used for buy or sell decision. We do not recommend any particular stocks. If particular stocks of such are mentioned, they are meant as demonstration of Amibroker as a powerful charting software and MACD. Amibroker can program to scan the stocks for buy and sell signals.
These are script generated signals. Not all scan results are shown here. The MACD signal should use with price action. Users must understand what MACD and price action are all about before using them. If necessary you should attend a course to learn more on Technical Analysis (TA) and Moving Average Convergence Divergence, MACD.
Once again, the website does not guarantee any results or investment return based on the information and instruction you have read here. It should be used as learning aids only and if you decide to trade real money, all trading decision should be your own.
We learn from many past and present great traders. Kudo to these master.