20 November 2020
Welcome to AmiBroker Academy, Moses Hong Kong Free Stock Charting. Thanks for visiting the site.
^HSI | Hang Seng Index Stock Charting
Study Hang Seng Index Stock 恒生指数 Charting and Price Action.
Picture worth a thousand words. See chart.
Trade with eyes open. Mange your risk.
Price Action
Price Action moves in zigzag manner.
Support Resistance or Trendline
Buy Support Sell Resistance.
River
Using moving average high, low and closed to form a band, called it river. River is a great visual tool for trending. But, ABCD pattern is a easy way to trade. You can use Fibonacci to help to see the pullback, ie bc sector.
Fibonacci
Add the fibonacci to the chart to help in identify where is the support or resistance.
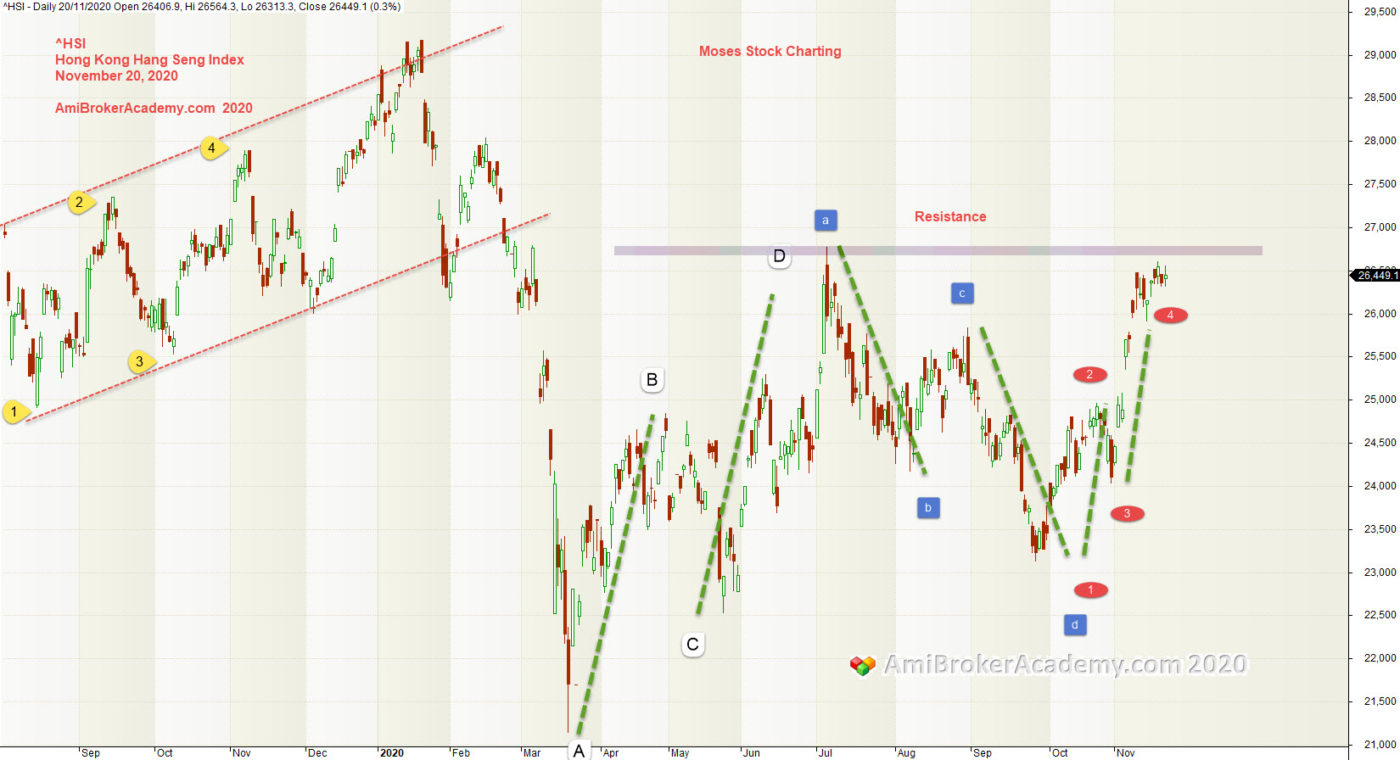
H M Gartley ABCD Pattern
Can you spot the ABCD pattern? There are many near perfection AB=CD pattern. Manage your risk.
Moses Stock Observation
摩西股票观察
AmiBrokerAcademy.com
Disclaimer
The above result is for illustration purpose. It is not meant to be used for buy or sell decision. We do not recommend any particular stocks. If particular stocks of such are mentioned, they are meant as demonstration of Amibroker as a powerful charting software and MACD. Amibroker can program to scan the stocks for buy and sell signals.
These are script generated signals. Not all scan results are shown here. The MACD signal should use with price action. Users must understand what MACD and price action are all about before using them. If necessary you should attend a course to learn more on Technical Analysis (TA) and Moving Average Convergence Divergence, MACD.
Once again, the website does not guarantee any results or investment return based on the information and instruction you have read here. It should be used as learning aids only and if you decide to trade real money, all trading decision should be your own.