15 September 2018
Let read the chart from a different view, …
Singapore Stock Stories
Thanks for visiting the site.
H17 HI-P International Charting
Study Support Resistance
To maximize your profit and minimize risk is to buy low sell high, or in other words, buy support sell resistance.
Study HI-P International stock price. Use buy support sell resistance strategy. Remember to take profit when the price action breakout below the bullish trend line. See chart picture worth a thousand words.
The stock price push all the way to 2.80 dollars in 2018. But, but the stock price also fail to stay high, and hit 90 cents in just a few months. See chart.
Trade with eyes open.
Manage your risk.
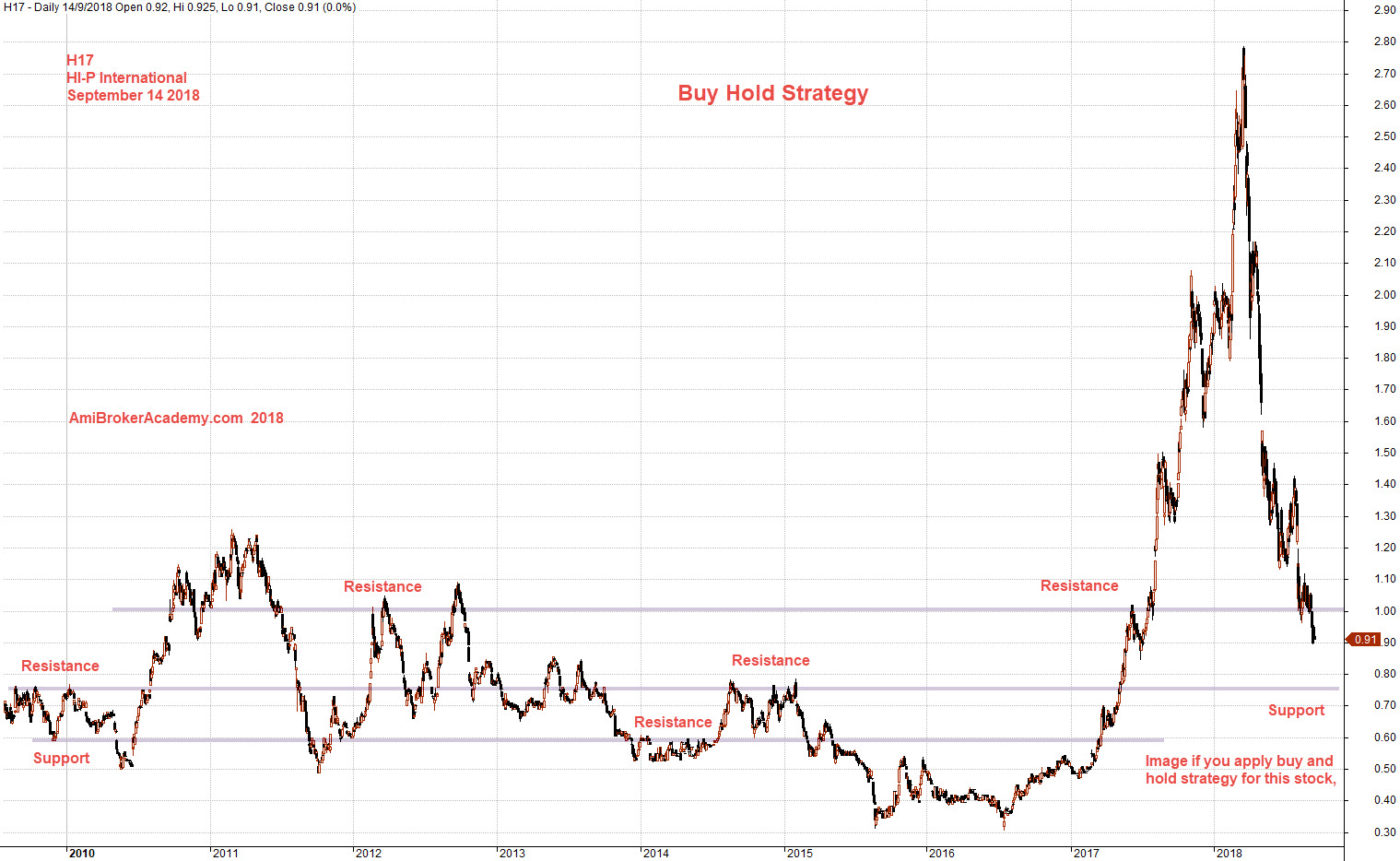
September 14, 2018 HI-P International Buy Hold Strategy
Zoom in, we add MACD indicator. We see has returned to twelve months low. Trade with eyes open.
Manage your risk.
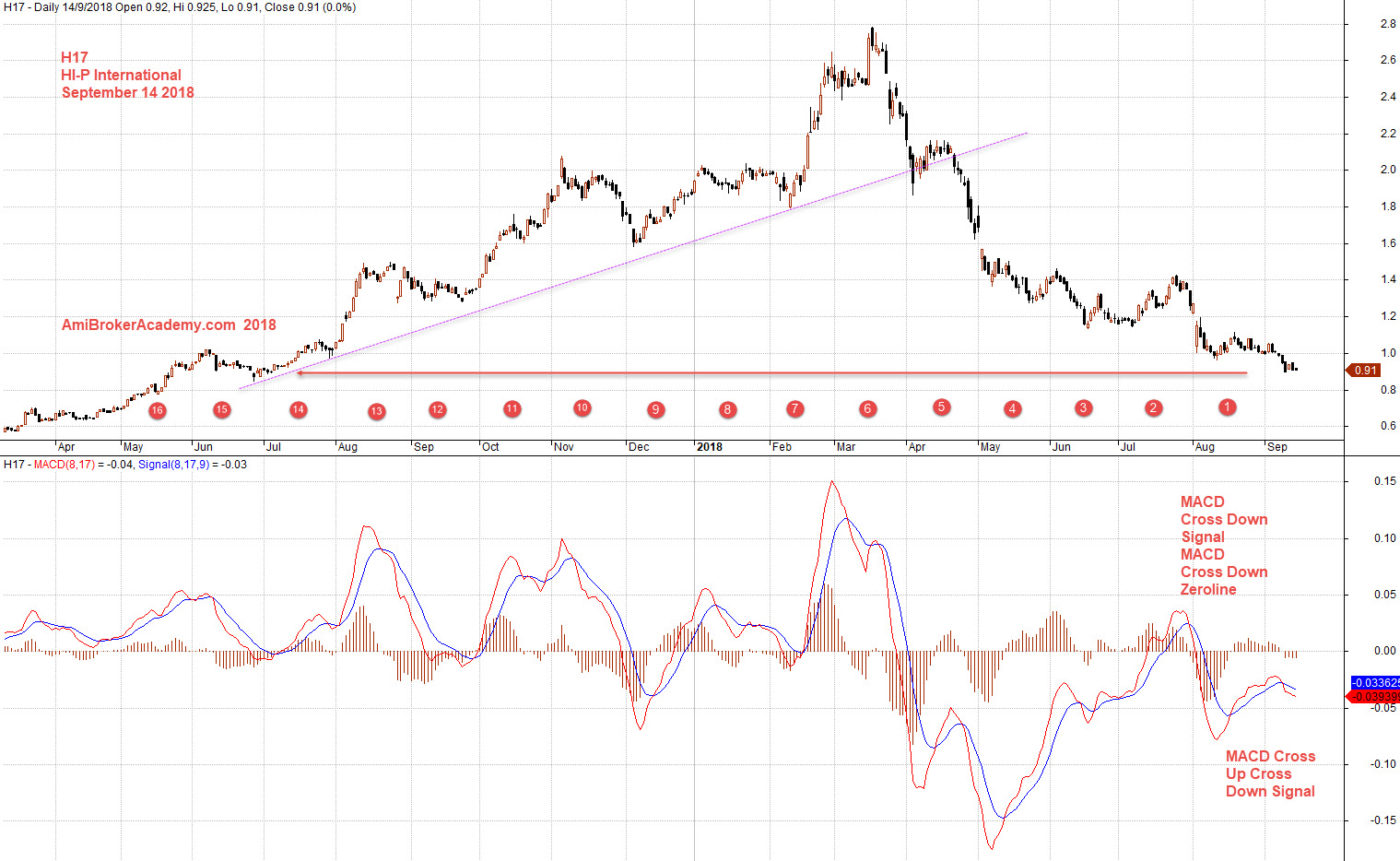
September 14, 2018 HI-P International and MACD
Moses
AmiBrokerAcademy.com – we are different
Disclaimer
The above result is for illustration purpose. It is not meant to be used for buy or sell decision. We do not recommend any particular stocks. If particular stocks of such are mentioned, they are meant as demonstration of Amibroker as a powerful charting software and MACD. Amibroker can program to scan the stocks for buy and sell signals.
These are script generated signals. Not all scan results are shown here. The MACD signal should use with price action. Users must understand what MACD and price action are all about before using them. If necessary you should attend a course to learn more on Technical Analysis (TA) and Moving Average Convergence Divergence, MACD.
Once again, the website does not guarantee any results or investment return based on the information and instruction you have read here. It should be used as learning aids only and if you decide to trade real money, all trading decision should be your own.