October 18, 2017
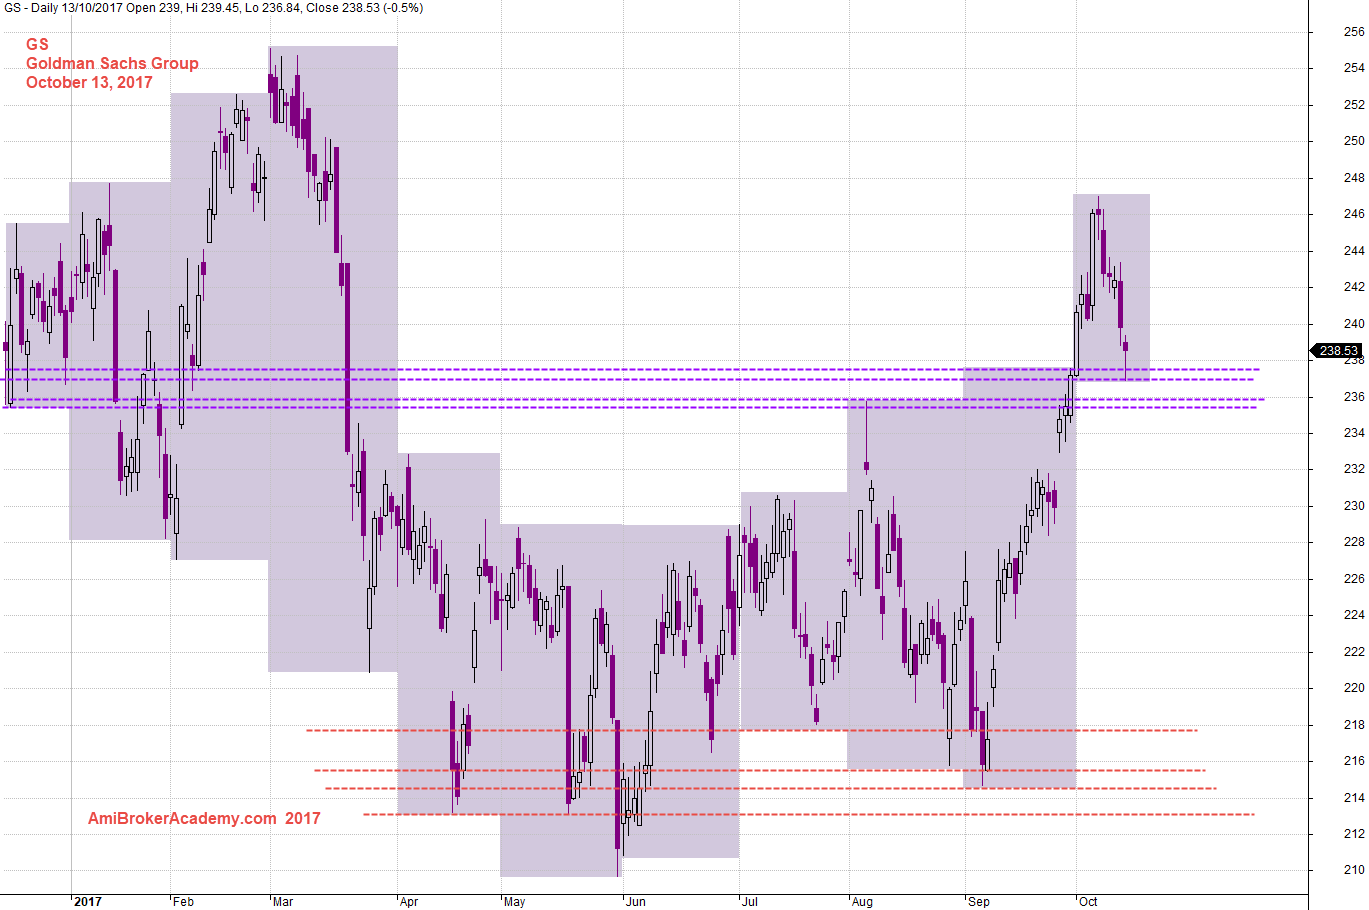
GS Goldman Sachs Group and Support Resistance
As picture worth a thousand words, see chart for more.
Price tried to breakout higher than 255, but fail. The share price test 210, the price get supported. Now the price get supported by 238. Can the support hold? Will see.
October 13, 2017 Goldman Sachs and Support Resistance
Goldman Sachs Group and Cup and Handle Pattern
As picture worth a thousand words, see chart for more.
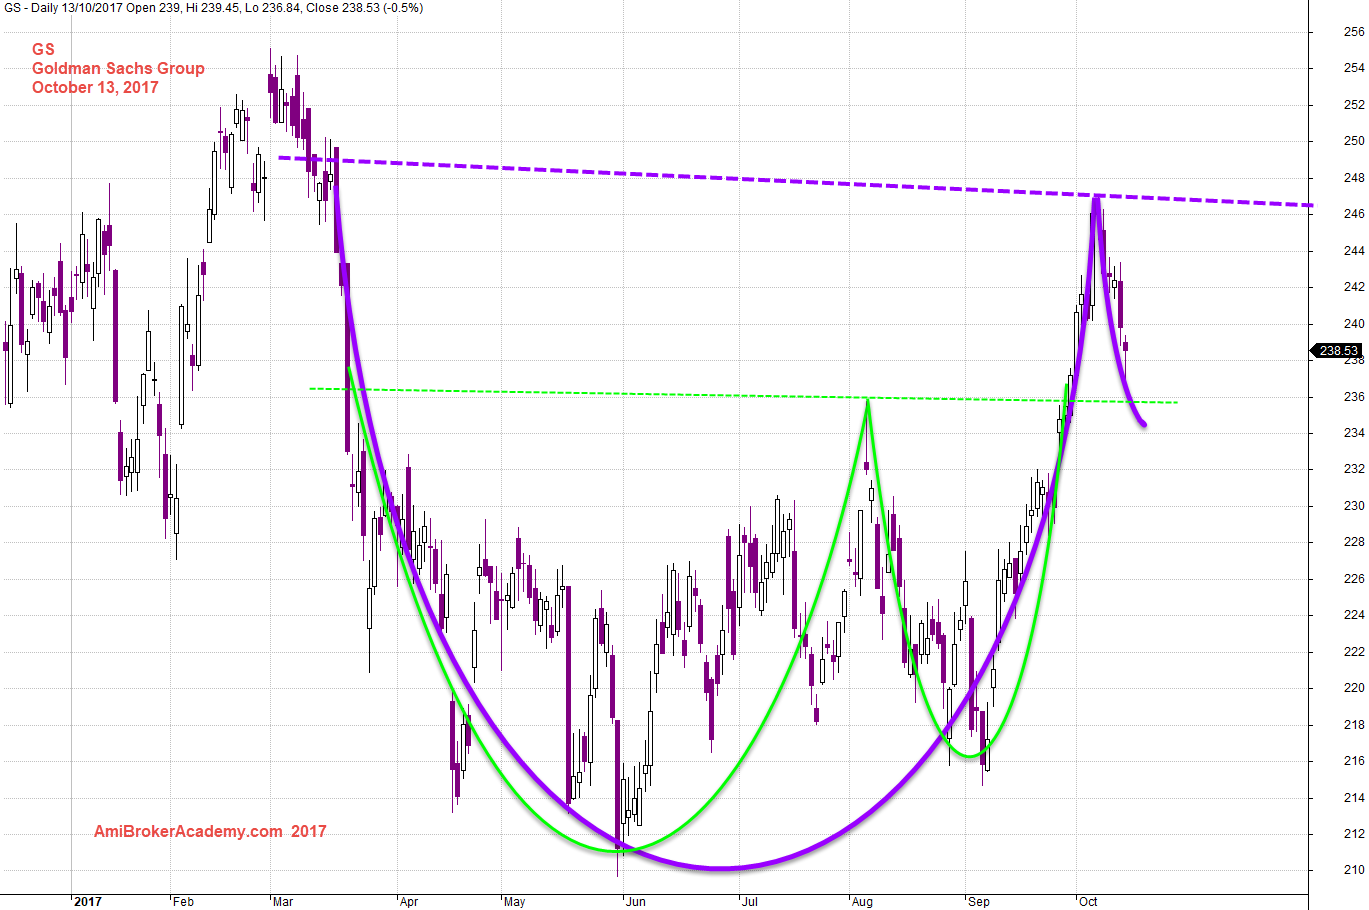
October 13, 2017 Goldman Sachs and Cup and Handle Pattern
Goldman Sachs Group and ABCD Chart Pattern
As picture worth a thousand words, see chart for more.
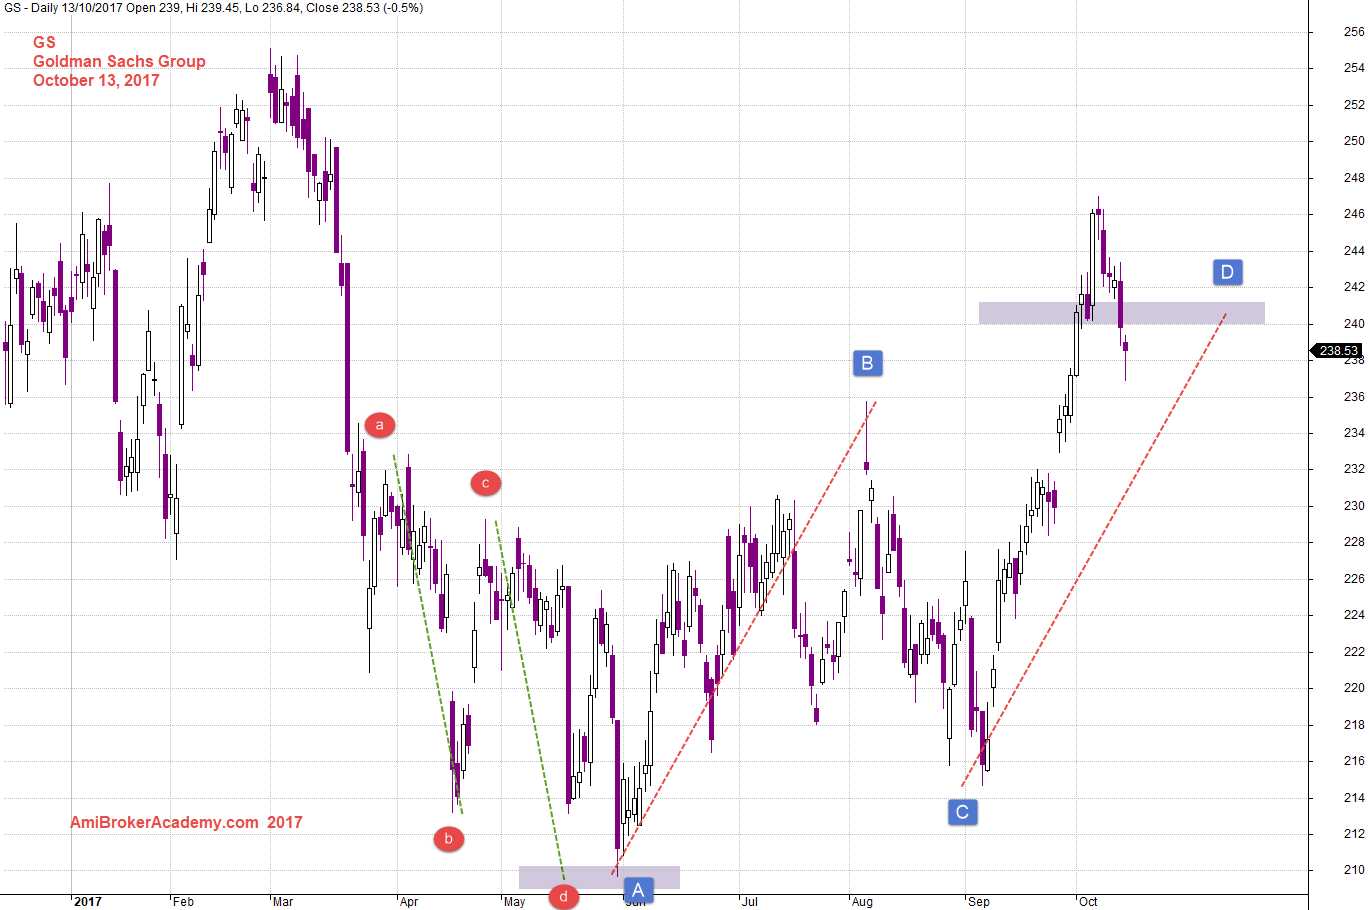
October 13, 2017 Goldman Sachs and ABCD Chart Pattern
Moses
AmiBrokerAcademy.com
Disclaimer
The above result is for illustration purpose. It is not meant to be used for buy or sell decision. We do not recommend any particular stocks. If particular stocks of such are mentioned, they are meant as demonstration of Amibroker as a powerful charting software and MACD. Amibroker can program to scan the stocks for buy and sell signals.
These are script generated signals. Not all scan results are shown here. The MACD signal should use with price action. Users must understand what MACD and price action are all about before using them. If necessary you should attend a course to learn more on Technical Analysis (TA) and Moving Average Convergence Divergence, MACD.
Once again, the website does not guarantee any results or investment return based on the information and instruction you have read here. It should be used as learning aids only and if you decide to trade real money, all trading decision should be your own.