13 August 2021
Welcome!
Welcome to AmiBroker Academy dot com, amibrokeracademy.com.
1) GOOG | Alphabet Inc and River
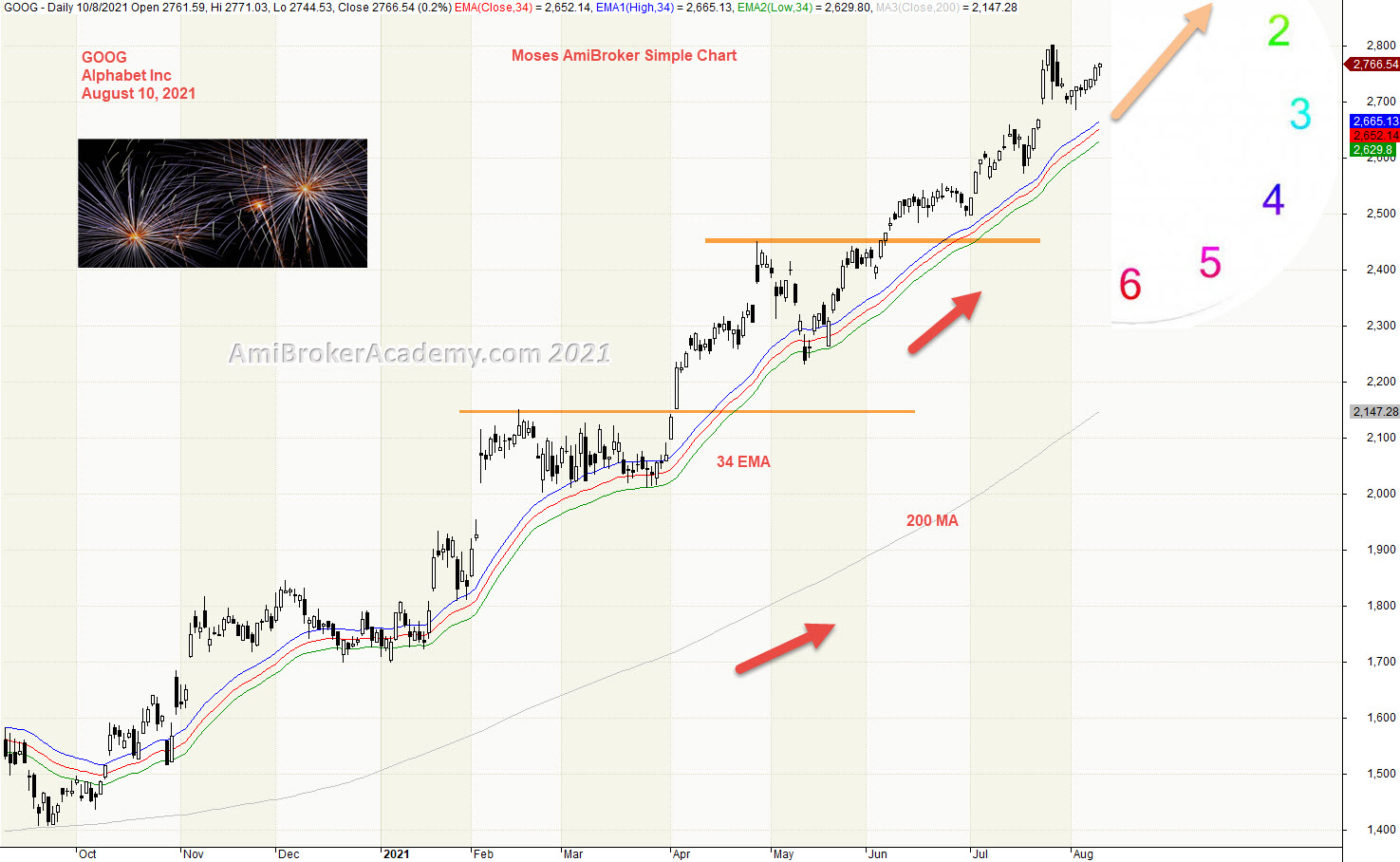
Study Alphabet Inc stock price action. Using moving averages, moving average is a good visual tool. For example Raghee uses 34 EMA, high, low and close moving averages to study the wave direction. We call the three MAs band as River.
River provides a very simple and direct bull or bear indication. When River pointing up, bull trend. When River pointing down, bear trend. When bull trend, price action is always above River. When bear trend, price action always below River.
River is pointing to one o’clock direction.
See chart, price action after cross up River, and it stays above the River.
Remember, we just read what the chart said. Have fun!
2) Alphabet Inc and MACD Divergence
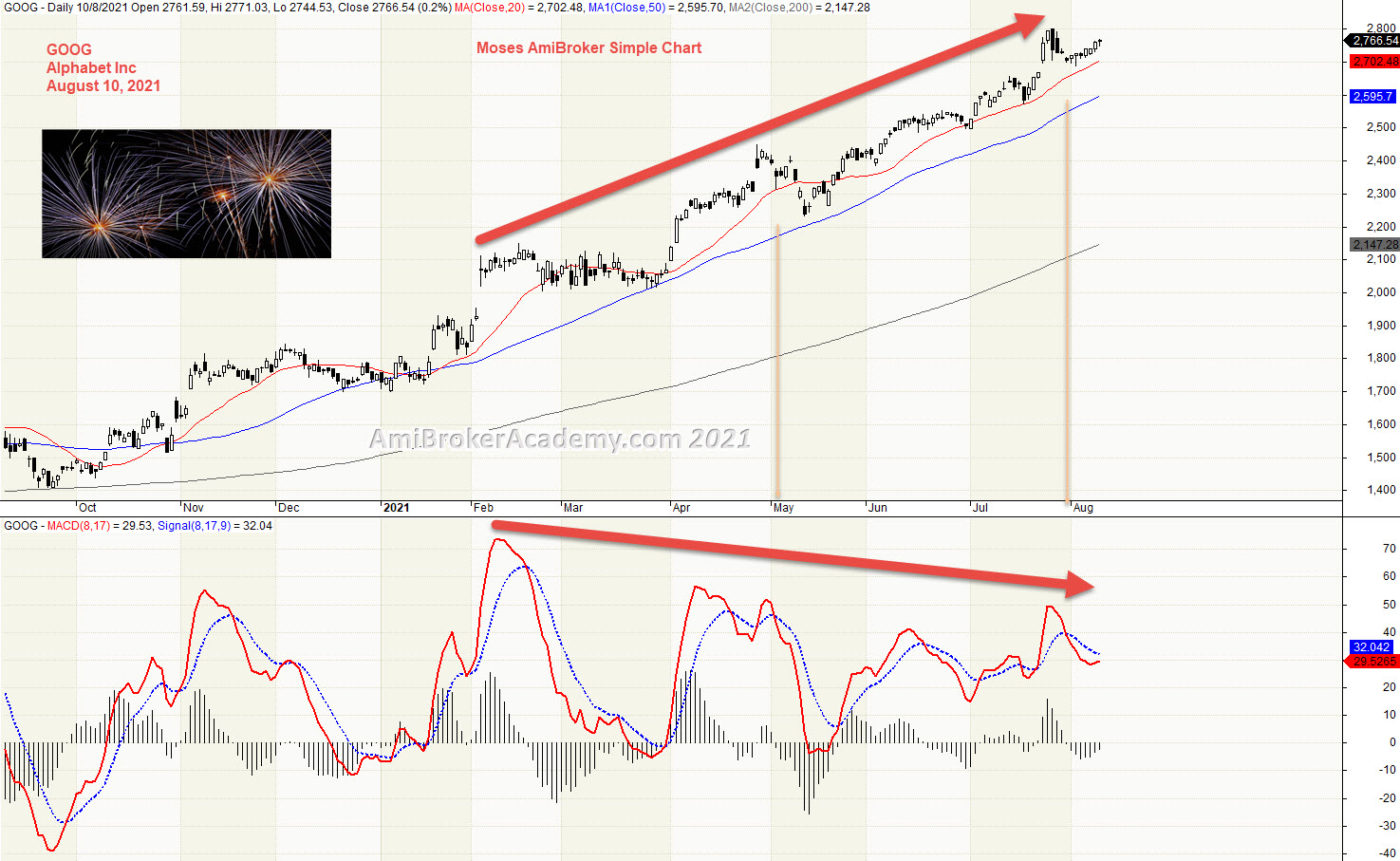
MACD is a great reversal tool, price action will pullback when it is weaken.
From the chart, price action continues to go higher. MACD forms lower high. MACD is like traffic light, MACD Divergence signal is potential pullback. You don’t stop at every traffic light, therefore MACD Divergence does not resulting a pullback. But the pullback could be real.
Trade what you see. Mange your risk.
3) Alphabet Inc and symmetry price action
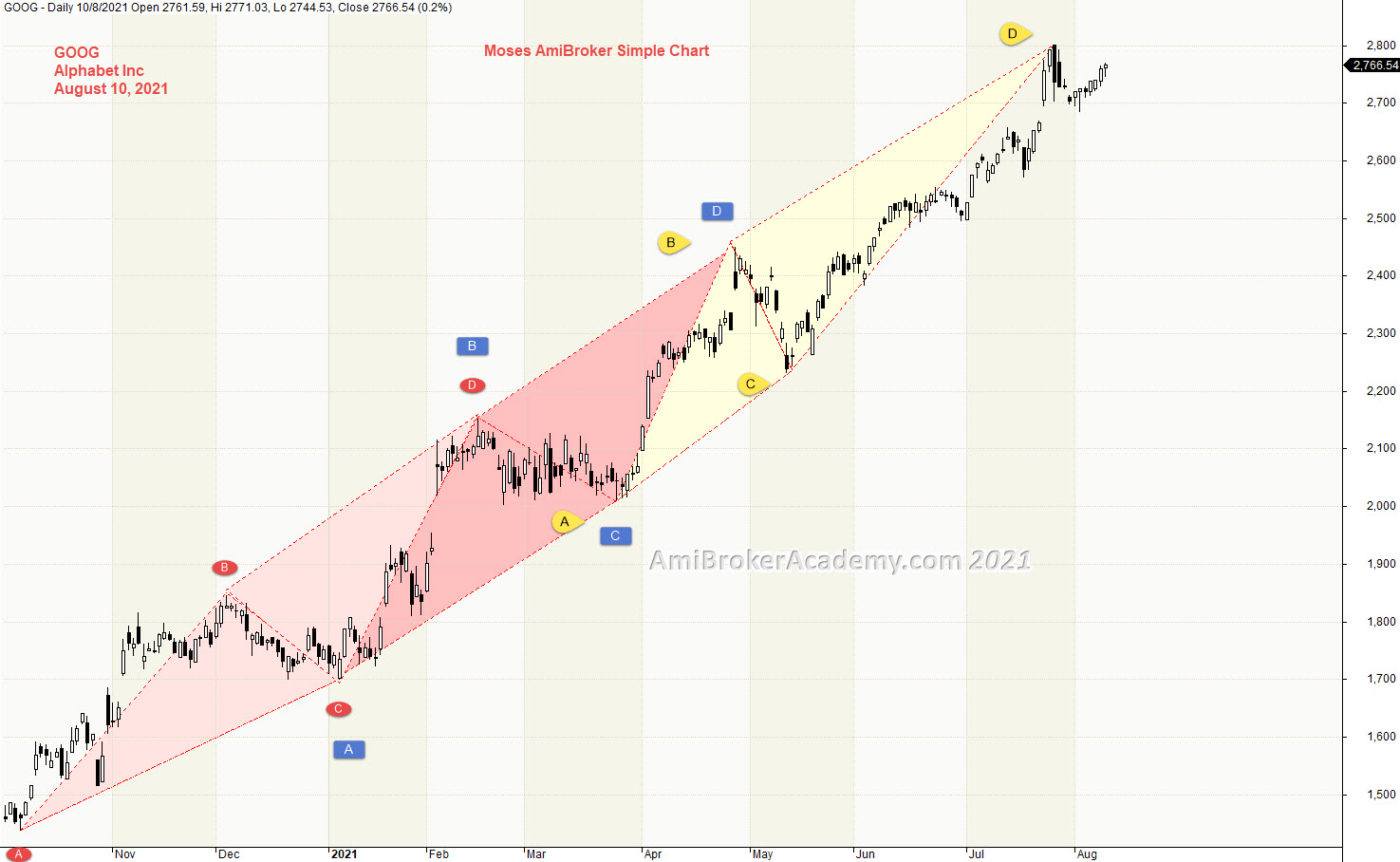
Market has memory, therefore many of the traders, including professional traders are trading on chart pattern, past memory.
See chart, there are many symmetrical triangles. Therefore, we find many AB=CD pattern.
We like to buy support sell resistance whenever that is possible.
Manage your risk.
Moses Power Charting
Official AmiBrokerAcademy.com Charting
Disclaimer
The above result is for illustration purpose. It is not meant to be used for buy or sell decision. We do not recommend any particular stocks. If particular stocks of such are mentioned, they are meant as demonstration of Amibroker as a powerful charting software and MACD. Amibroker can program to scan the stocks for buy and sell signals.
These are script generated signals. Not all scan results are shown here. The MACD signal should use with price action. Users must understand what MACD and price action are all about before using them. If necessary you should attend a course to learn more on Technical Analysis (TA) and Moving Average Convergence Divergence, MACD.
Once again, the website does not guarantee any results or investment return based on the information and instruction you have read here. It should be used as learning aids only and if you decide to trade real money, all trading decision should be your own.
We learn from many past and present great traders. Kudo to these master.