1 May 2018
US Stock Chart Analysis
GOOG Alphabet Inc Charting – Fibonacci
Study Google stock price, Alphabet Inc. Key level like 1000 dollars, 78% had tested many times. See chart, picture worth a thousand words. You can also spot ABCD pattern easily. We add Fibonacci on the chart, swing low to high.
Manage your risk.
Powerful Chart Software – AmiBroker
The following chart is produced using AmiBroker charting software. It is a powerful chart software. Anything, finance ticket you could download from Yahoo! Finance you could plot them, those you are interested all in a chart, so you could analyse them.
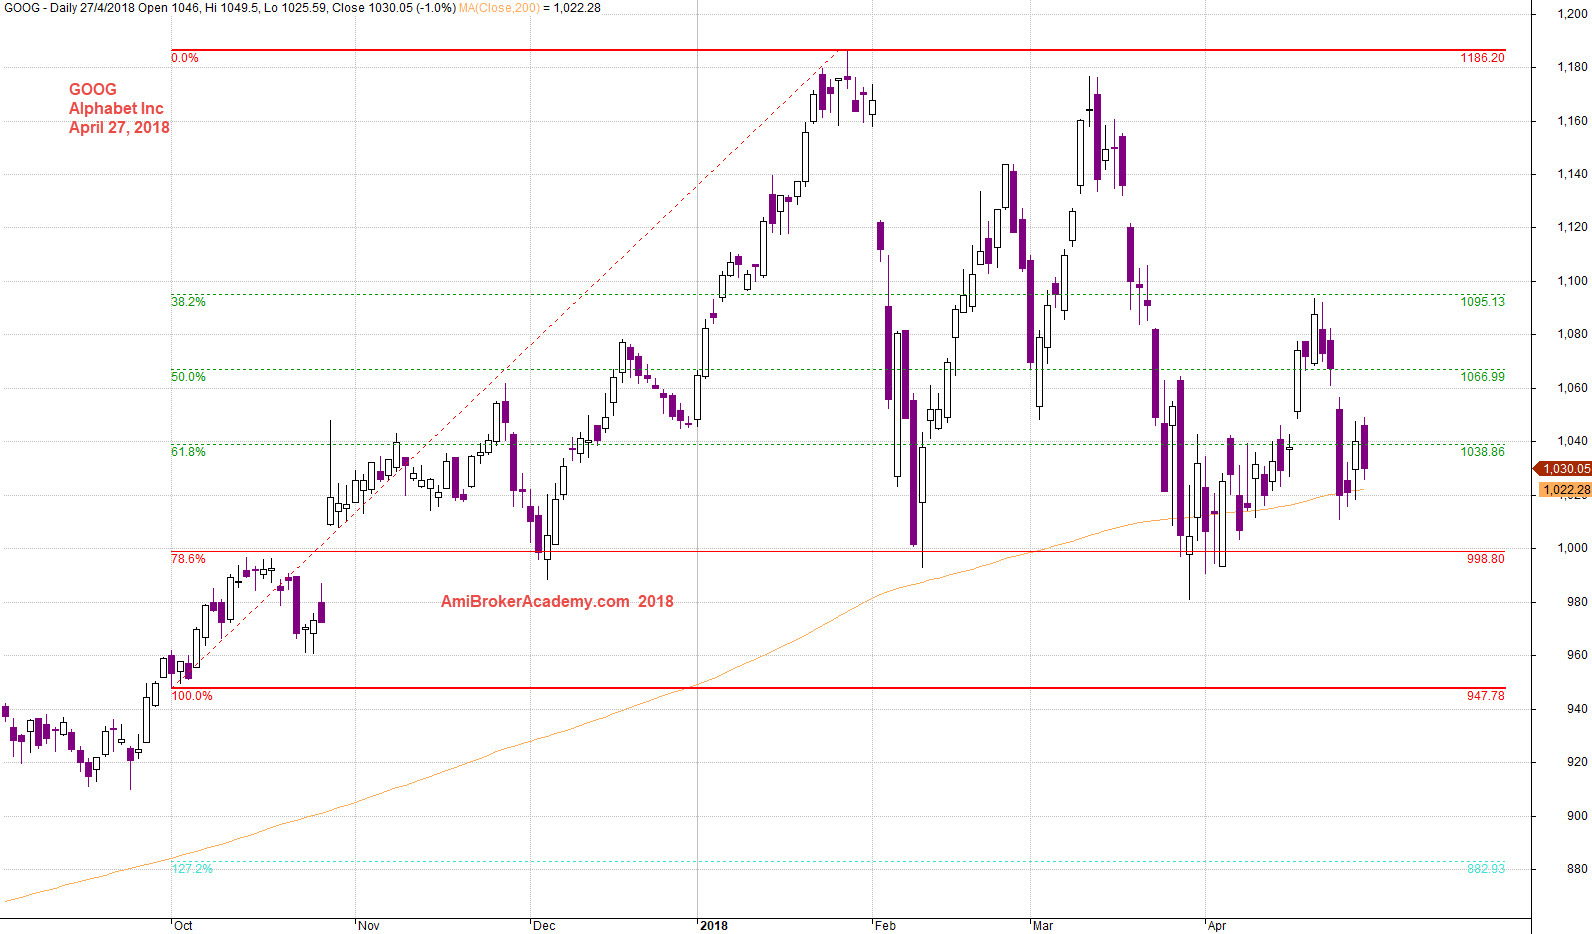
April 27, 2018 Alphabet Inc and Fibonacci Retracement Low to High
GOOG Alphabet Inc Charting and MACD
See chart for more, picture worth a thousand words.
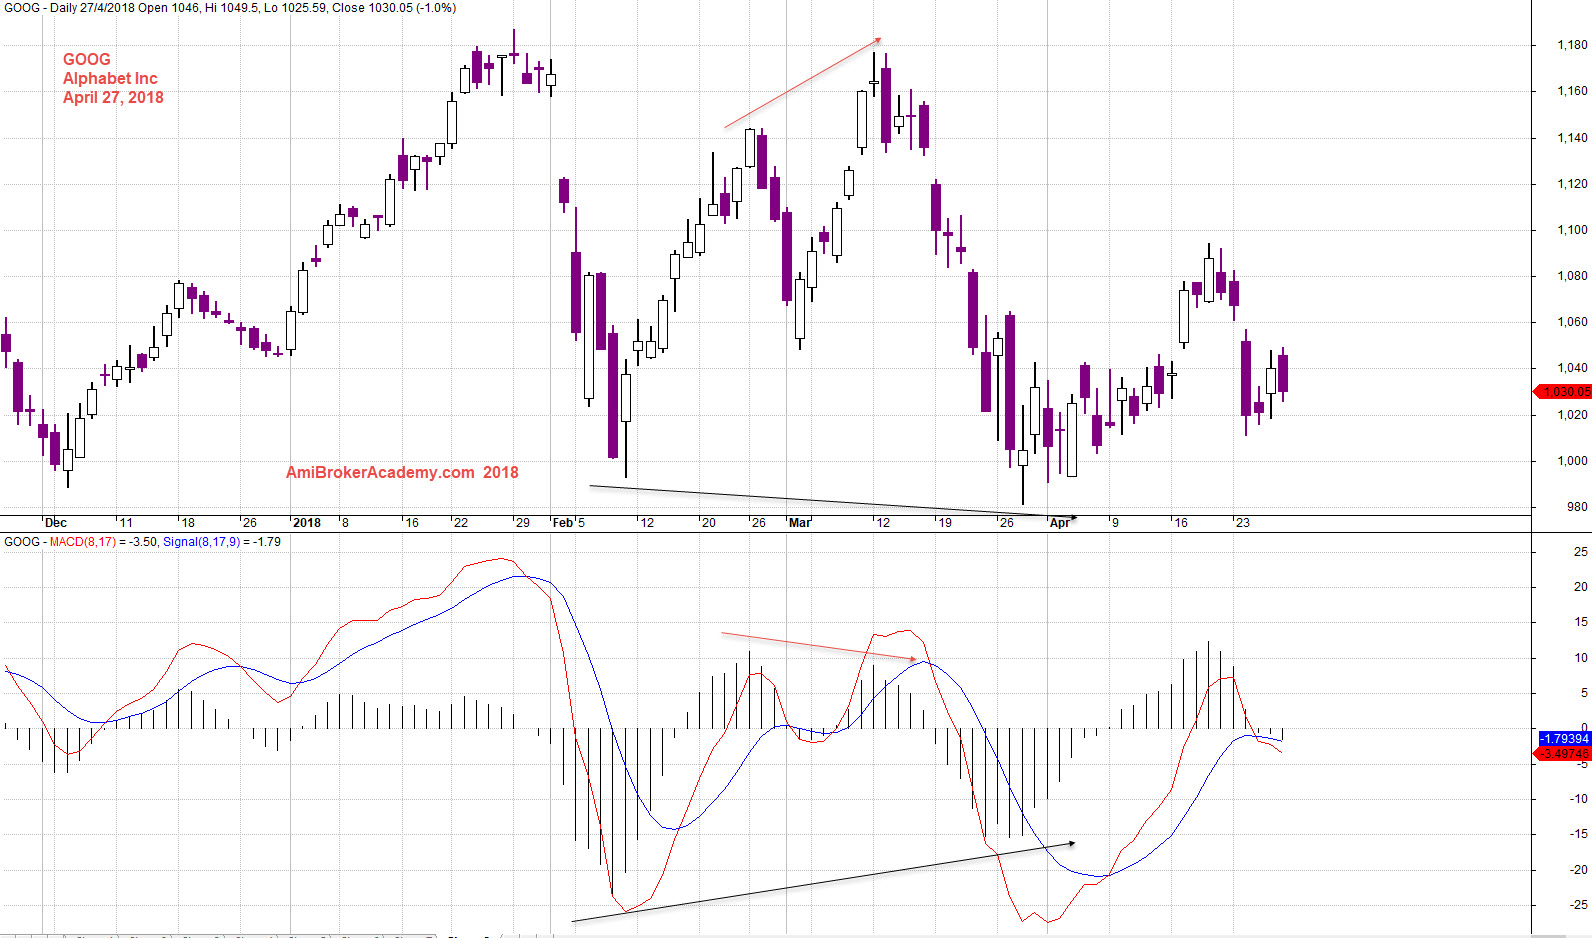
April 27, 2018 Alphabet Inc and MACD
Moses Stock Chart Analysis
AmiBrokerAcademy.com
Disclaimer
The above result is for illustration purpose. It is not meant to be used for buy or sell decision. We do not recommend any particular stocks. If particular stocks of such are mentioned, they are meant as demonstration of Amibroker as a powerful charting software and MACD. Amibroker can program to scan the stocks for buy and sell signals.
These are script generated signals. Not all scan results are shown here. The MACD signal should use with price action. Users must understand what MACD and price action are all about before using them. If necessary you should attend a course to learn more on Technical Analysis (TA) and Moving Average Convergence Divergence, MACD.
Once again, the website does not guarantee any results or investment return based on the information and instruction you have read here. It should be used as learning aids only and if you decide to trade real money, all trading decision should be your own.