3 October, 2019
Welcome to AmiBrokerAcademy.com. Thanks for visiting the site.
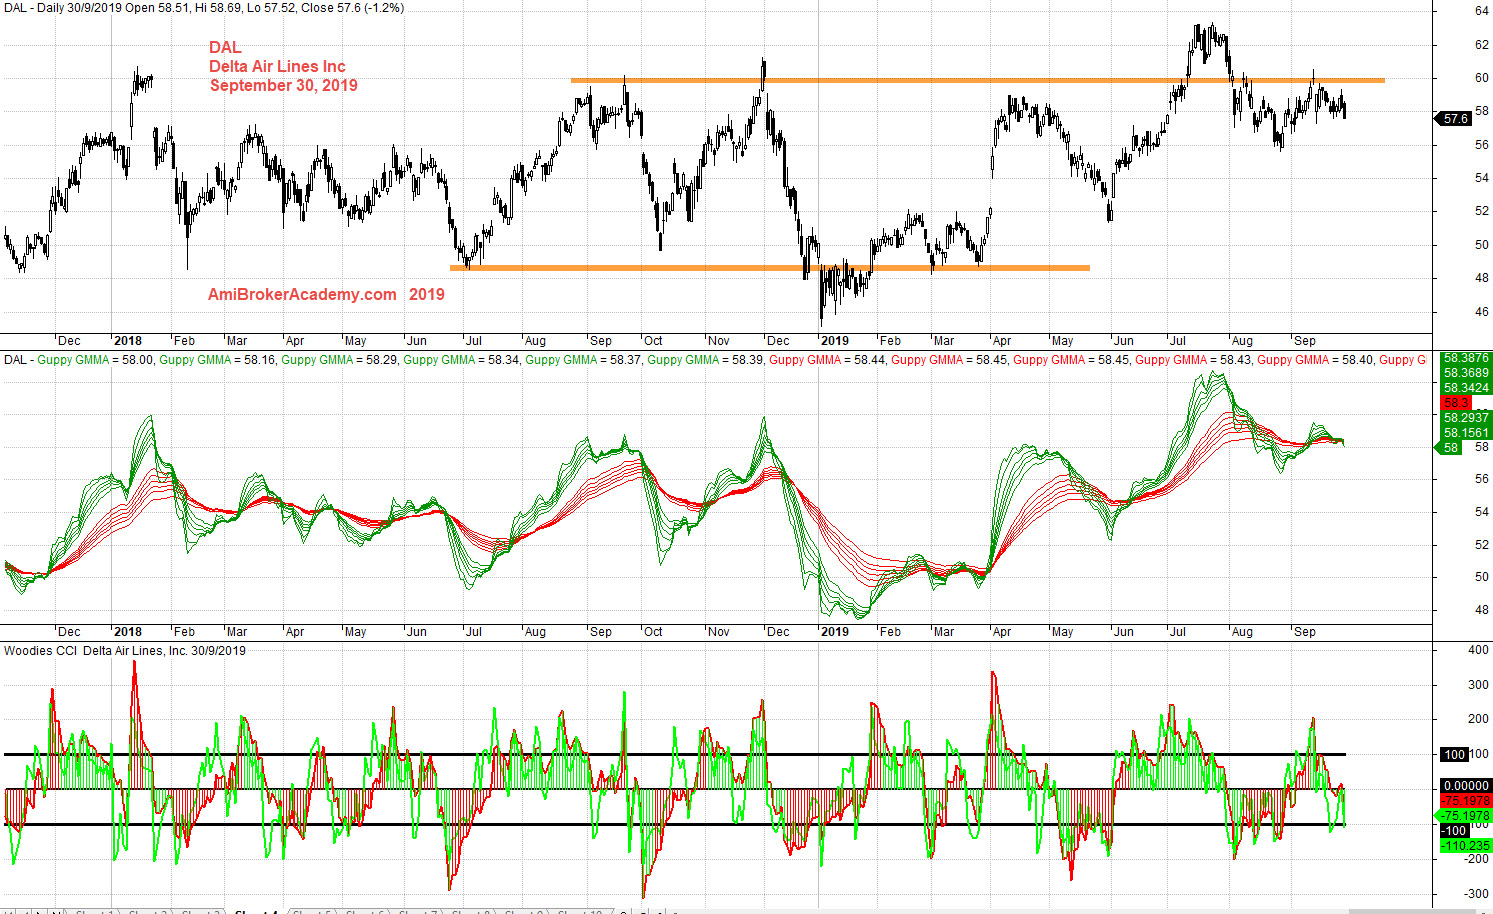
DAL Delta Air Lines Inc Stock Charting
Study Delta Air Lines Inc stock chart and GMMA and Woodies CCI.
Look left and think right. It’s depending your expectation.
See chart, picture worth a thousand words.
Price Action goes from high to low, low to high again. … Sideways.
Very difficult to trade. Buy Hold strategy will be going no where.
Trade with your eyes open.
Moses Stock Observation
AmiBrokerAcademy.com
Disclaimer
The above result is for illustration purpose. It is not meant to be used for buy or sell decision. We do not recommend any particular stocks. If particular stocks of such are mentioned, they are meant as demonstration of Amibroker as a powerful charting software and MACD. Amibroker can program to scan the stocks for buy and sell signals.
These are script generated signals. Not all scan results are shown here. The MACD signal should use with price action. Users must understand what MACD and price action are all about before using them. If necessary you should attend a course to learn more on Technical Analysis (TA) and Moving Average Convergence Divergence, MACD.
Once again, the website does not guarantee any results or investment return based on the information and instruction you have read here. It should be used as learning aids only and if you decide to trade real money, all trading decision should be your own.