14 July, 2019
Welcome to AmiBrokerAcademy.com. Thanks for visiting the site.
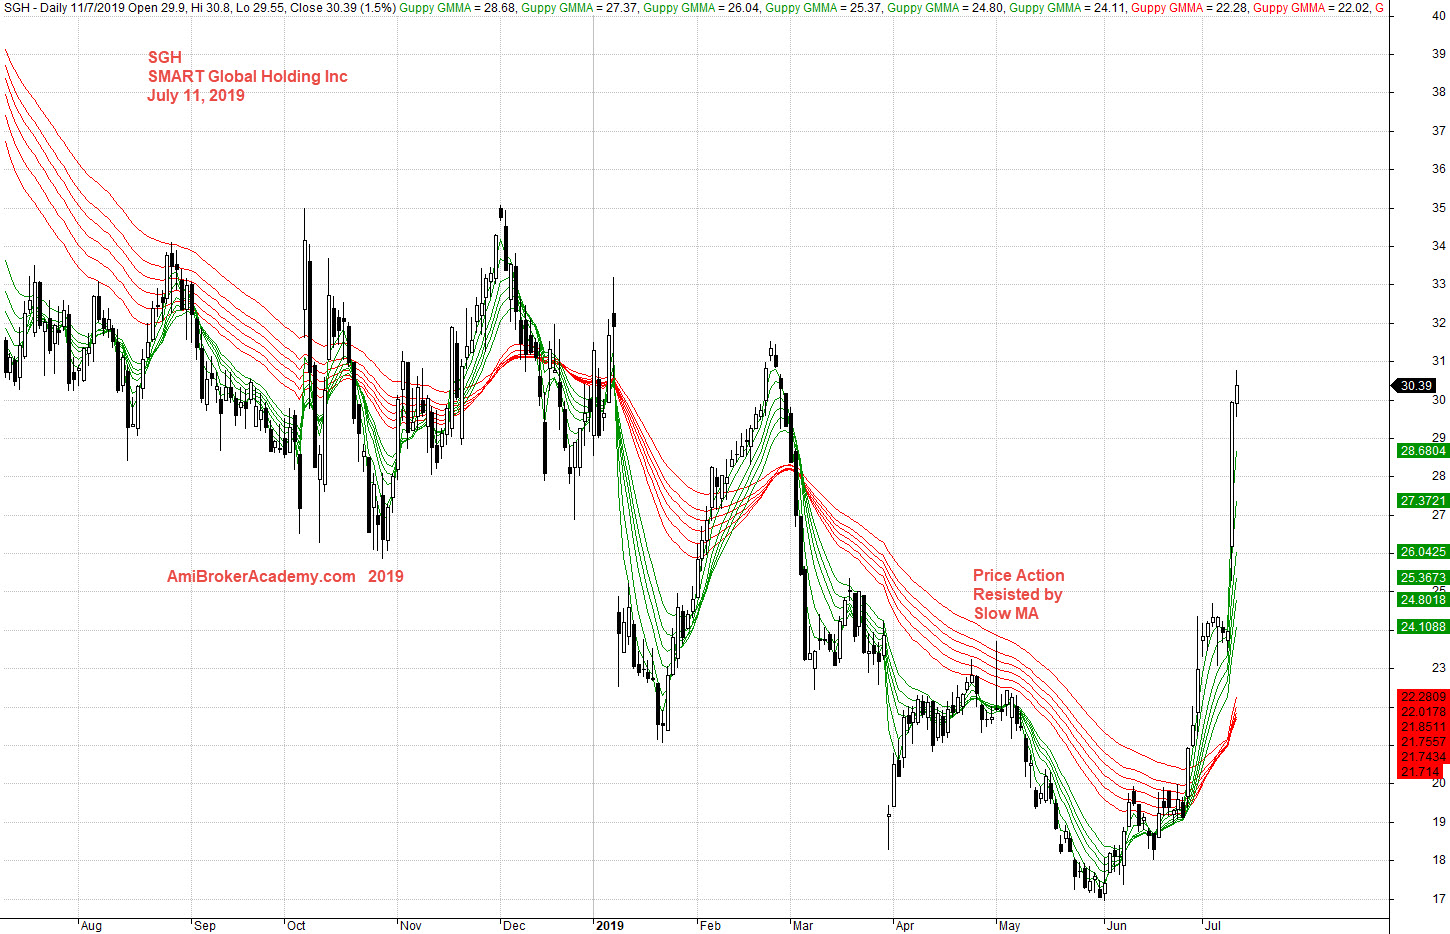
SGH SMART Global Holding Inc Stock Charting
Study SMART Global Holding Inc Stock chart and Guppy Multiple Moving Average.
See chart, picture worth a thousand words.
Majority of the time fast MA below slow MA, price action is also true below slow MA.
Besides that, slow MA is slopping down from top left to bottom right. When you have tool like GMMA, do not forget to open your eyes to see other useful chart pattern. We could easily identify a ABCD down pattern. This imply that after the price action complete the ABCD, the price may pull back.
With this in mind, you should be on a look out to buy up. With the narrow of slow MA, and open up of fast MA, you can manage your risk and enter a buy trade.
Trade with your eyes open.
Moses Stock Observation
AmiBrokerAcademy.com
Disclaimer
The above result is for illustration purpose. It is not meant to be used for buy or sell decision. We do not recommend any particular stocks. If particular stocks of such are mentioned, they are meant as demonstration of Amibroker as a powerful charting software and MACD. Amibroker can program to scan the stocks for buy and sell signals.
These are script generated signals. Not all scan results are shown here. The MACD signal should use with price action. Users must understand what MACD and price action are all about before using them. If necessary you should attend a course to learn more on Technical Analysis (TA) and Moving Average Convergence Divergence, MACD.
Once again, the website does not guarantee any results or investment return based on the information and instruction you have read here. It should be used as learning aids only and if you decide to trade real money, all trading decision should be your own.