July 5, 2018
Thanks for visiting the site.
July is the start of the second half, let’s look back how the last six months performance.
The first half of the year has been cloudy with all the tariff policy and caused many of the companies become wary. Many has already impacted by the coming changes. You probably has read about deduction is labour and production. Companies stop sourcing from within the country due to the high material costs and so on.
At the end, all lost and no winner. The only thing left is the history of the unplanned decision. Will see.
Just read, China Mobile can not operate on the US group. I thought it was amazing to have global company uses services from company like China Mobile, as you can achieve the one stop service for your network problem. It guess we are returning to the non global operation soon. Global companies probably should consider selling off all the overseas businesses and stay within the county. In this case, you will not get impacted by all the rule, policy and tariff.
In fact, if you will ask some economist, many of them will tell you globalization has cause more harm then good.
Shanghai Stock Analysis – Trade with Eyes Open
Fujian Expressway Development Co Charting
Study Fujian Expressway Development Co stock chart on its half yearly performance. You will surprise to see 600033.SS stock the price action is continuing to decline from 2017. No more expressway to build soon. True or true?
Manage your risk.
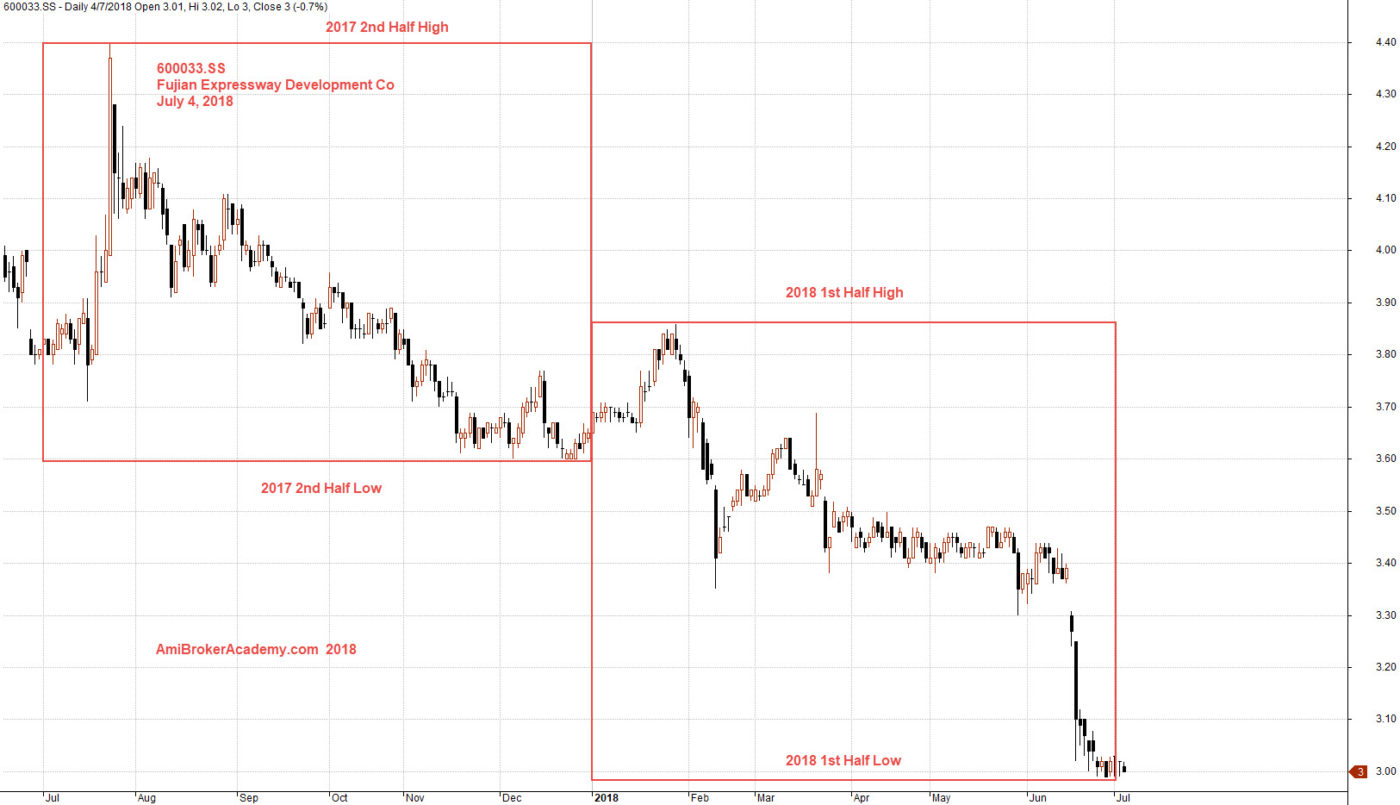
July 4, 2018 Fujian Expressway Development Co and Half Year Performance
Fujian Expressway Development Co 600033.SS Charting and Stochastic Oscillator
Picture worth a thousand words, see chart.
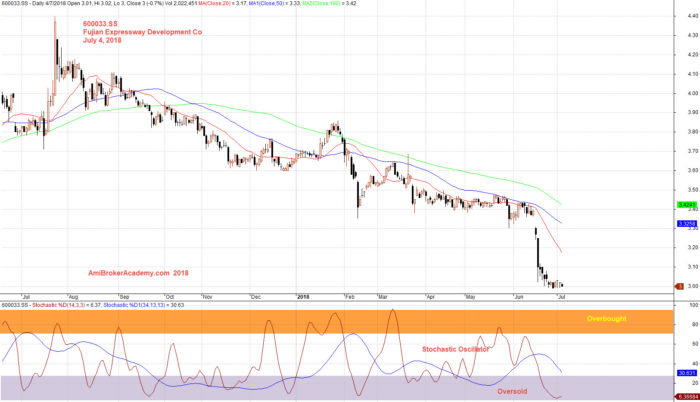
July 4, 2018 Fujian Expressway Development Co and Stochastic Signals
Moses
AmiBrokerAcademy.com
Disclaimer
The above result is for illustration purpose. It is not meant to be used for buy or sell decision. We do not recommend any particular stocks. If particular stocks of such are mentioned, they are meant as demonstration of Amibroker as a powerful charting software and MACD. Amibroker can program to scan the stocks for buy and sell signals.
These are script generated signals. Not all scan results are shown here. The MACD signal should use with price action. Users must understand what MACD and price action are all about before using them. If necessary you should attend a course to learn more on Technical Analysis (TA) and Moving Average Convergence Divergence, MACD.
Once again, the website does not guarantee any results or investment return based on the information and instruction you have read here. It should be used as learning aids only and if you decide to trade real money, all trading decision should be your own.