11 April, 2018
Powerful Chart Software – AmiBroker
The following chart is produced using AmiBroker charting software. It is a powerful chart software. You plot the stocks you are interested all in one chart, as long as you still could read them.
Singapore Stock Analysis – Study Chart From Day One
Zoom Out BDX GSH Corporation Stock Price Chart
Study the GSH Corporation stock price from day one, see chart. The stock at the bottom near zero from 2009 to 2012. And the stock is able to bounce back up to the high created in 2007. Well done. From the big picture, we see the stock price is now near support of the resistance turns support. Picture worth a thousand words, see chart for more.
Manage your risk.
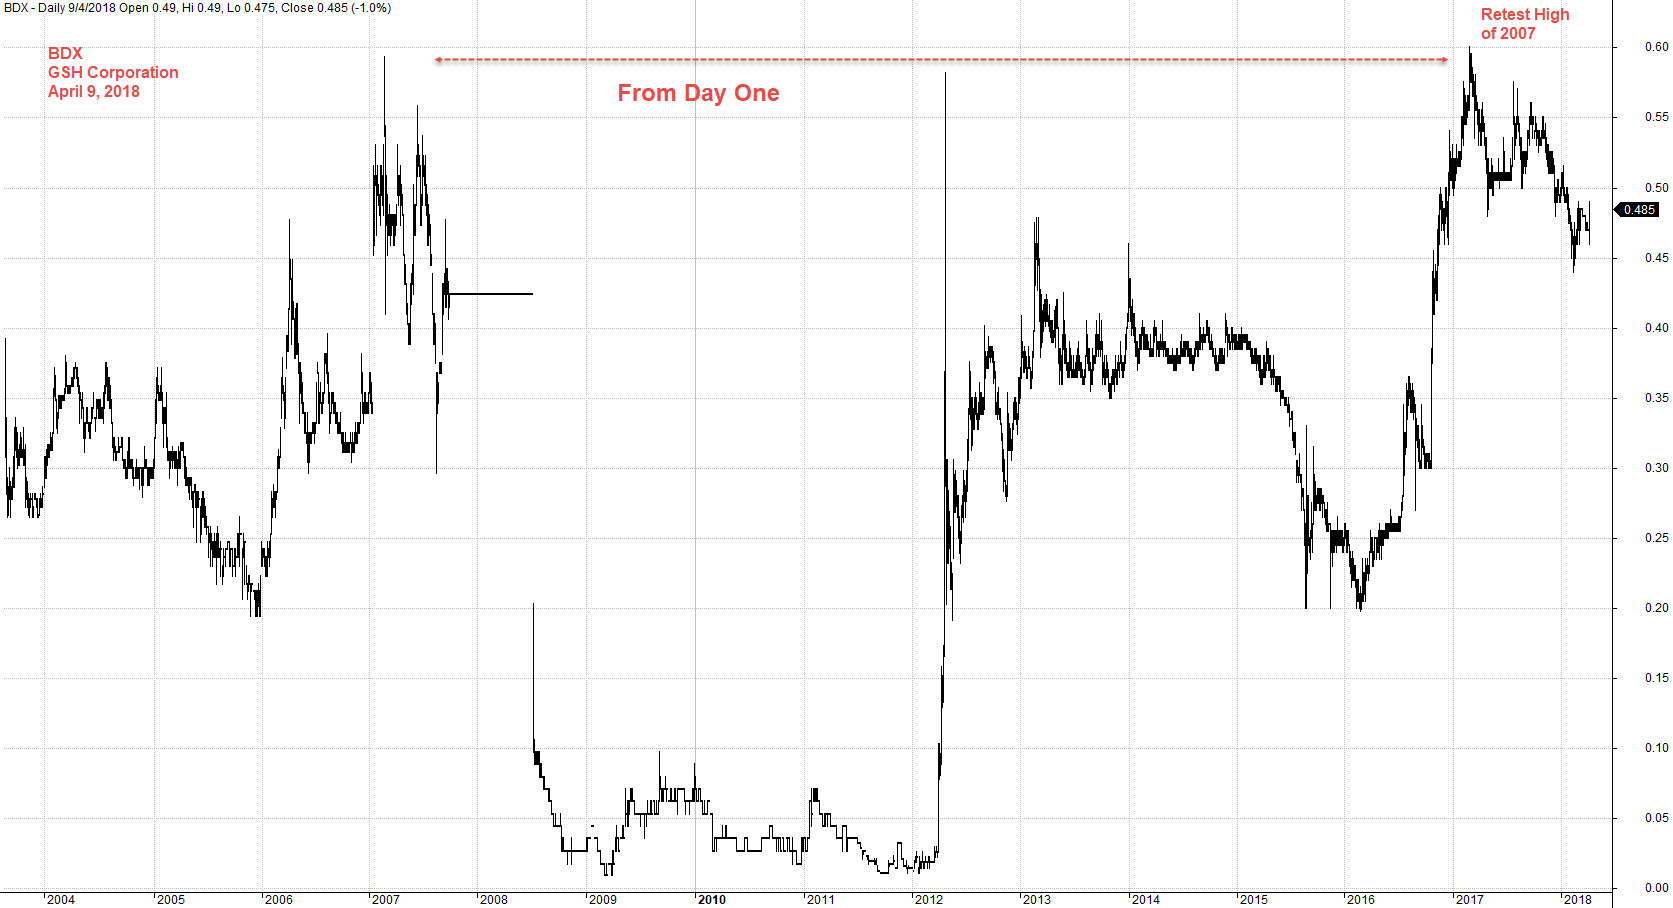
April 9, 2018 GSH Corporation from Day One
Moses Singapore Stock Analysis
AmiBrokerAcademy.com
Disclaimer
The above result is for illustration purpose. It is not meant to be used for buy or sell decision. We do not recommend any particular stocks. If particular stocks of such are mentioned, they are meant as demonstration of Amibroker as a powerful charting software and MACD. Amibroker can program to scan the stocks for buy and sell signals.
These are script generated signals. Not all scan results are shown here. The MACD signal should use with price action. Users must understand what MACD and price action are all about before using them. If necessary you should attend a course to learn more on Technical Analysis (TA) and Moving Average Convergence Divergence, MACD.
Once again, the website does not guarantee any results or investment return based on the information and instruction you have read here. It should be used as learning aids only and if you decide to trade real money, all trading decision should be your own.