September 6, 2018
Thanks for visiting the site.
Free U.S. Stock MACD Scan
What is MACD?
MACD stands for Moving Average Convergence Divergence, common setting is (12,26,9)
MACD indicator is a trend trading system that makes up of 2 lines. The MACD Line (fast line) and MACD Signal Line (slow line).
1) When the MACD Line crosses over the MACD Signal Line the trend is bullish. When the MACD Line crosses below the MACD Signal the trend is bearish.
2) When the MACD Line crosses above zero line the trend is bullish. When the MACD line crosses below zero line the trend is bearish.
Example of MACD Indicator – Kansas City Southern

September 5, 2018 Kansas City Southern and MACD
September 5 2018 – Script Generated One-day U.S. Stock MACD Signals
The following are script generated One-day U.S. Stock Market MACD signals using the Powerful AmiBroker’s AFL.
The MACD Setting used is (8,17,9)
Relatively, lesser MACD signals as compare to those days that have many more trading signals. Why? May be end of the month? May be August?
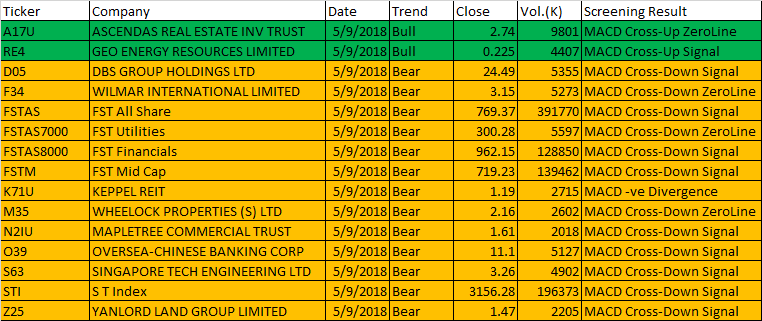
September 5, 2018 Singapore Stock One-day MACD Trend
| Ticker | Company | Date | Trend | Close | Vol.(K) | Screening Result |
| PDCO | Patterson Companies, Inc. | 5/9/2018 | Bull | 23.74 | 3824 | MACD Cross-Up Signal |
| PPL | PPL Corporation | 5/9/2018 | Bull | 30.45 | 3527 | MACD Cross-Up Signal |
| RF | Regions Financial Corporation | 5/9/2018 | Bull | 19.97 | 6078 | MACD Cross-Up Signal |
| SBUX | Starbucks Corporation | 5/9/2018 | Bull | 53.935 | 4194 | MACD Cross-Up Signal |
| AAPL | Apple Inc. | 5/9/2018 | Bear | 226.07 | 14105 | MACD-H -ve Divergence |
| BABA | Alibaba Group Holding Limited | 5/9/2018 | Bear | 165.546 | 12748 | MACD Cross-Down Signal |
| C | Citigroup Inc. | 5/9/2018 | Bear | 71.385 | 3795 | MACD Cross-Down Signal |
| CMCSA | Comcast Corporation | 5/9/2018 | Bear | 36.29 | 7068 | MACD Cross-Down Signal |
| CRM | Salesforce.com Inc | 5/9/2018 | Bear | 148.59 | 3341 | MACD Cross-Down Signal |
| CSCO | Cisco Systems, Inc. | 5/9/2018 | Bear | 47.115 | 7760 | MACD Cross-Down Signal |
| CTRP | Ctrip.com International, Ltd. | 5/9/2018 | Bear | 37.8 | 3112 | MACD Cross-Down Signal |
| DAL | Delta Air Lines, Inc. | 5/9/2018 | Bear | 57.19 | 4765 | MACD Cross-Down Signal |
| DVN | Devon Energy Corporation | 5/9/2018 | Bear | 41.75 | 3386 | MACD Cross-Down ZeroLine |
| MSFT | Microsoft Corporation | 5/9/2018 | Bear | 108.88 | 17279 | MACD -ve Divergence |
| TAL | TAL Education Group | 5/9/2018 | Bear | 27.62 | 4650 | MACD Cross-Down Signal |
| TLT | iShares 20+ Year Treasury Bond ETF | 5/9/2018 | Bear | 119.705 | 4462 | MACD Cross-Down ZeroLine |
| TSG | The Stars Group Inc. | 5/9/2018 | Bear | 25 | 3410 | MACD Cross-Down Signal |
| WDAY | Workday, Inc. | 5/9/2018 | Bear | 144.47 | 4068 | MACD Cross-Down Signal |
Moses U.S. Stock MACD Scan
AmiBroker Academy.com
Disclaimer
The above result is for illustration purpose. It is not meant to be used for buy or sell decision. We do not recommend any particular stocks. If particular stocks of such are mentioned, they are meant as demonstration of Amibroker as a powerful charting software and MACD. Amibroker can program to scan the stocks for buy and sell signals.
These are script generated signals. Not all scan results are shown here. The MACD signal should use with price action. Users must understand what MACD and price action are all about before using them. If necessary you should attend a course to learn more on Technical Analysis (TA) and Moving Average Convergence Divergence, MACD.
Once again, the website does not guarantee any results or investment return based on the information and instruction you have read here. It should be used as learning aids only and if you decide to trade real money, all trading decision should be your own.