September 27, 2018
Thanks for visiting the site.
Free U.S. Stock MACD Scan
What is MACD?
MACD stands for Moving Average Convergence Divergence, common setting is (12,26,9)
MACD indicator is a trend trading system that makes up of 2 lines. The MACD Line (fast line) and MACD Signal Line (slow line).
1) When the MACD Line crosses over the MACD Signal Line the trend is bullish. When the MACD Line crosses below the MACD Signal the trend is bearish.
2) When the MACD Line crosses above zero line the trend is bullish. When the MACD line crosses below zero line the trend is bearish.
MACD Example – Celgene Corporation
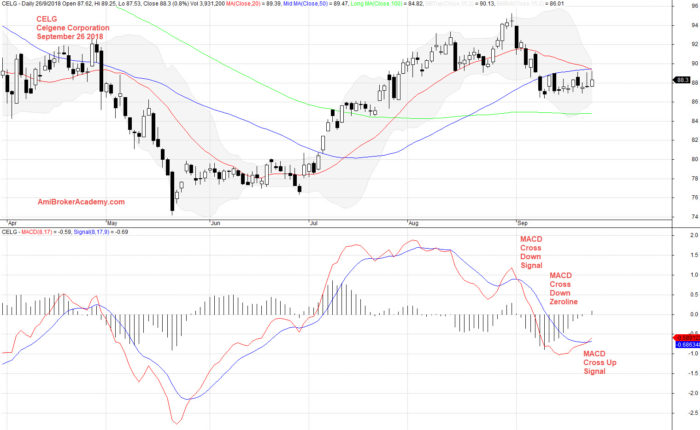
September 26, 2018 Celgene Corporation and MACD
MACD Example – Celgene Corporation Monthly
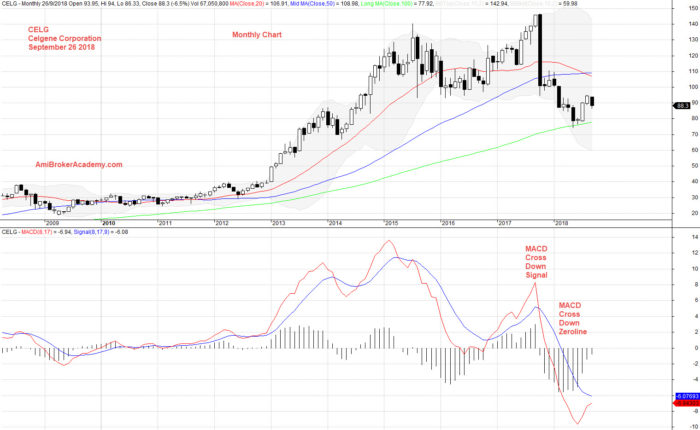
September 26, 2018 Celgene Corporation Monthly and MACD
September 26 2018 – Script Generated One-day U.S. Stock MACD Signals
The following are script generated One-day U.S. Stock Market MACD signals using the Powerful AmiBroker’s AFL.
The MACD Setting used is (8,17,9)
| Ticker | Company | Date | Trend | Close | Vol.(K) | Screening Result |
| AABA | Altaba Inc. | 26/9/2018 | Bullish | 68.13 | 4722 | MACD Cross-Up ZeroLine |
| ATVI | Activision Blizzard, Inc | 26/9/2018 | Bullish | 81.57 | 6391 | MACD Cross-Up Signal |
| CELG | Celgene Corporation | 26/9/2018 | Bullish | 88.3 | 3931 | MACD Cross-Up Signal |
| EBAY | eBay Inc. | 26/9/2018 | Bullish | 33.58 | 13776 | MACD-H +ve Divergence |
| FL | Foot Locker, Inc. | 26/9/2018 | Bullish | 50.12 | 4525 | MACD Cross-Up ZeroLine |
| FOX | Twenty-First Century Fox, Inc. | 26/9/2018 | Bullish | 45.26 | 5810 | MACD Cross-Up ZeroLine |
| FOXA | Twenty-First Century Fox, Inc. | 26/9/2018 | Bullish | 45.67 | 11122 | MACD Cross-Up ZeroLine |
| GOOS | Canada Goose Holdings Inc. | 26/9/2018 | Bullish | 63.64 | 3935 | MACD Cross-Up Signal |
| JD | JD.com, Inc. | 26/9/2018 | Bullish | 25.2 | 31057 | MACD +ve Divergence |
| M | Macy’s Inc | 26/9/2018 | Bullish | 34.89 | 8755 | MACD-H +ve Divergence |
| NLSN | Nielsen N.V. | 26/9/2018 | Bullish | 27.96 | 9396 | MACD Cross-Up Signal |
| PZZA | Papa John’s International, Inc. | 26/9/2018 | Bullish | 50.14 | 9315 | MACD-H +ve Divergence |
| SQ | Square, Inc. | 26/9/2018 | Bullish | 94.65 | 25488 | MACD Cross-Up Signal |
| TSLA | Tesla, Inc. | 26/9/2018 | Bullish | 309.58 | 7837 | MACD Cross-Up ZeroLine |
| UAA | Under Armour, Inc. | 26/9/2018 | Bullish | 21.1 | 5294 | MACD Cross-Up ZeroLine |
| WY | Weyerhaeuser Company | 26/9/2018 | Bullish | 32.72 | 3961 | MACD-H +ve Divergence |
| XRAY | DENTSPLY SIRONA Inc. | 26/9/2018 | Bullish | 38.03 | 4281 | MACD +ve Divergence |
| AFL | Aflac Incorporated | 26/9/2018 | Bearish | 47.04 | 3599 | MACD Cross-Down Signal |
| BAC | Bank of America Corporation | 26/9/2018 | Bearish | 30.13 | 57775 | MACD Cross-Down Signal |
| BPY | Brookfield Property Partners L.P. | 26/9/2018 | Bearish | 20.49 | 3829 | MACD -ve Divergence |
| CHGG | Chegg, Inc. | 26/9/2018 | Bearish | 28.42 | 5160 | MACD Cross-Down ZeroLine |
| CMCSA | Comcast Corporation | 26/9/2018 | Bearish | 35.37 | 19660 | MACD Cross-Down ZeroLine |
| CRM | Salesforce.com Inc | 26/9/2018 | Bearish | 158.33 | 3985 | MACD-H -ve Divergence |
| CSCO | Cisco Systems, Inc. | 26/9/2018 | Bearish | 48.41 | 20058 | MACD-H -ve Divergence |
| CTL | CenturyLink, Inc. | 26/9/2018 | Bearish | 20.73 | 15550 | MACD Cross-Down ZeroLine |
| EPD | Enterprise Products Partners L.P. | 26/9/2018 | Bearish | 28.72 | 3786 | MACD Cross-Down ZeroLine |
| EQT | EQT Corporation | 26/9/2018 | Bearish | 44.44 | 3460 | MACD Cross-Down Signal |
| FDC | First Data Corporation | 26/9/2018 | Bearish | 24.51 | 10284 | MACD Cross-Down ZeroLine |
| FITB | Fifth Third Bancorp | 26/9/2018 | Bearish | 28.45 | 3855 | MACD Cross-Down Signal |
| FTI | TechnipFMC plc | 26/9/2018 | Bearish | 32.22 | 4308 | MACD-H -ve Divergence |
| FTXO | First Trust Nasdaq Bank ETF | 26/9/2018 | Bearish | 28.34 | 8037 | MACD Cross-Down Signal |
| GLW | Corning Incorporated | 26/9/2018 | Bearish | 35.4 | 4860 | MACD Cross-Down Signal |
| GM | General Motors Company | 26/9/2018 | Bearish | 33.73 | 17039 | MACD Cross-Down Signal |
| IP | International Paper Company | 26/9/2018 | Bearish | 50.95 | 5556 | MACD Cross-Down ZeroLine |
| JBL | Jabil Inc. | 26/9/2018 | Bearish | 27.41 | 5369 | MACD Cross-Down ZeroLine |
| MRO | Marathon Oil Corporation | 26/9/2018 | Bearish | 22.44 | 12578 | MACD-H -ve Divergence |
| MS | Morgan Stanley | 26/9/2018 | Bearish | 47.7 | 8269 | MACD Cross-Down Signal |
| MSFT | Microsoft Corporation | 26/9/2018 | Bearish | 113.98 | 19325 | MACD -ve Divergence |
| NKE | Nike, Inc. | 26/9/2018 | Bearish | 83.7 | 16312 | MACD Cross-Down Signal |
| RF | Regions Financial Corporation | 26/9/2018 | Bearish | 18.94 | 9239 | MACD Cross-Down Signal |
| SLCA | U.S. Silica Holdings, Inc. | 26/9/2018 | Bearish | 18.56 | 4499 | MACD Cross-Down Signal |
| T | AT&T Inc. | 26/9/2018 | Bearish | 33.35 | 32633 | MACD Cross-Down Signal |
| TEVA | Teva Pharmaceutical Industries Limited | 26/9/2018 | Bearish | 21.96 | 27698 | MACD Cross-Down Signal |
| TOT | Total S.A. | 26/9/2018 | Bearish | 64.76 | 5704 | MACD-H -ve Divergence |
| WMT | Wal-Mart Stores, Inc. | 26/9/2018 | Bearish | 94.59 | 5908 | MACD Cross-Down ZeroLine |
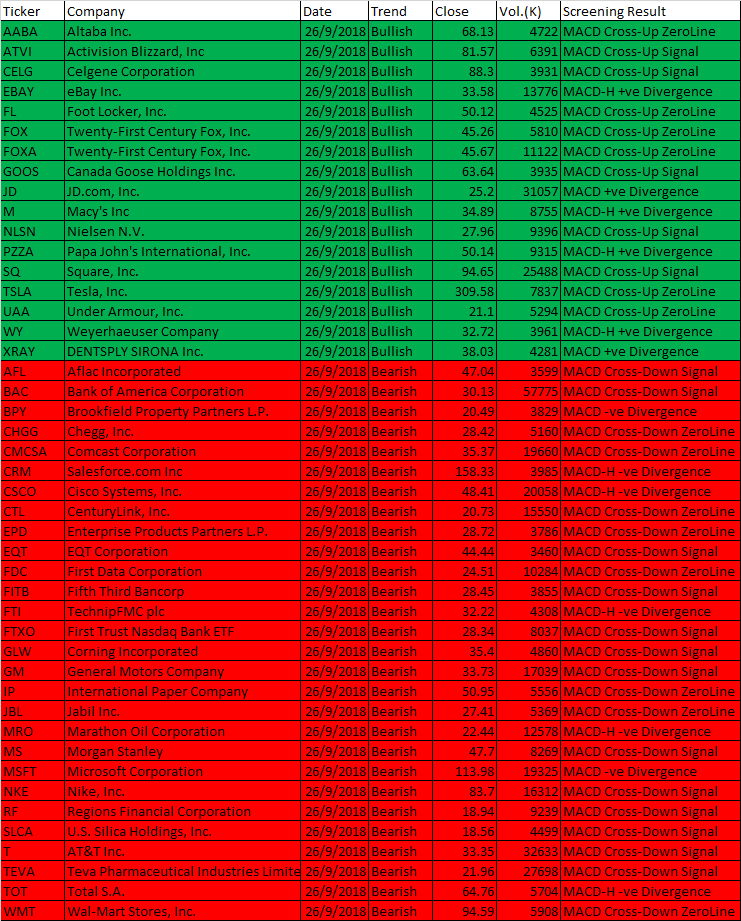
September 26, 2018 US Stock MACD One-day Scan Results
Moses U.S. Stock MACD Scan
AmiBroker Academy.com
Disclaimer
The above result is for illustration purpose. It is not meant to be used for buy or sell decision. We do not recommend any particular stocks. If particular stocks of such are mentioned, they are meant as demonstration of Amibroker as a powerful charting software and MACD. Amibroker can program to scan the stocks for buy and sell signals.
These are script generated signals. Not all scan results are shown here. The MACD signal should use with price action. Users must understand what MACD and price action are all about before using them. If necessary you should attend a course to learn more on Technical Analysis (TA) and Moving Average Convergence Divergence, MACD.
Once again, the website does not guarantee any results or investment return based on the information and instruction you have read here. It should be used as learning aids only and if you decide to trade real money, all trading decision should be your own.