16 October, 2018
Thanks for visiting the site.
Free U.S. Stock MACD Scan
What is MACD?
MACD stands for Moving Average Convergence Divergence, common setting is (12,26,9)
MACD indicator is a trend trading system that makes up of 2 lines. The MACD Line (fast line) and MACD Signal Line (slow line).
1) When the MACD Line crosses over the MACD Signal Line the trend is bullish. When the MACD Line crosses below the MACD Signal the trend is bearish.
2) When the MACD Line crosses above zero line the trend is bullish. When the MACD line crosses below zero line the trend is bearish.
October 15 2018 – Script Generated One-day U.S. Stock MACD Signals
The following are script generated One-day U.S. Stock Market MACD signals using the Powerful AmiBroker’s AFL.
The MACD Setting used is (8,17,9)
| Ticker | Company | Date | Signals | Close | Vol.(K) | Screening Result |
| ACHC | Acadia Healthcare Company, Inc. | 15/10/2018 | Bullish | 35.94 | 5263 | MACD-H +ve Divergence |
| BEN | Franklin Resources, Inc. | 15/10/2018 | Bullish | 28.95 | 3438 | MACD-H +ve Divergence |
| GM | General Motors Company | 15/10/2018 | Bullish | 32.12 | 13621 | MACD-H +ve Divergence |
| GSK | GlaxoSmithKline PLC | 15/10/2018 | Bullish | 38.88 | 3279 | MACD-H +ve Divergence |
| KHC | The Kraft Heinz Company | 15/10/2018 | Bullish | 54.47 | 3770 | MACD-H +ve Divergence |
| KR | Kroger Company (The) | 15/10/2018 | Bullish | 27.5 | 6746 | MACD-H +ve Divergence |
| LLL | L3 Technologies, Inc. | 15/10/2018 | Bullish | 220.91 | 3989 | MACD Cross-Up Signal |
| NI | NiSource, Inc | 15/10/2018 | Bullish | 24.75 | 4903 | MACD +ve Divergence |
| PHM | PulteGroup, Inc. | 15/10/2018 | Bullish | 22.94 | 3156 | MACD +ve Divergence |
| SO | Southern Company (The) | 15/10/2018 | Bullish | 44.22 | 6543 | MACD Cross-Up ZeroLine |
| TAL | TAL Education Group | 15/10/2018 | Bullish | 23.12 | 4027 | MACD Cross-Up Signal |
| TEVA | Teva Pharmaceutical Industries Limited | 15/10/2018 | Bullish | 21.74 | 7881 | MACD Cross-Up Signal |
| UAA | Under Armour, Inc. | 15/10/2018 | Bullish | 18.76 | 3572 | MACD +ve Divergence |
| WMB | Williams Companies, Inc. (The) | 15/10/2018 | Bullish | 26.77 | 6792 | MACD-H +ve Divergence |
| ZAYO | Zayo Group Holdings, Inc. | 15/10/2018 | Bullish | 31.83 | 5186 | MACD-H +ve Divergence |
| DUK | Duke Energy Corporation | 15/10/2018 | Bearish | 80.13 | 3018 | MACD Cross-Down Signal |
| HAL | Halliburton Company | 15/10/2018 | Bearish | 39.8 | 11180 | MACD Cross-Down ZeroLine |
| WMT | Wal-Mart Stores, Inc. | 15/10/2018 | Bearish | 93.82 | 8305 | MACD Cross-Down Signal |
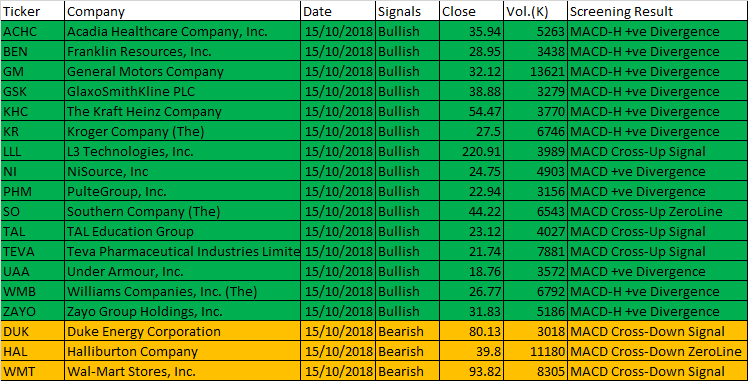
October 15, 2018 US Stock One-day MACD Scan Results
Example of MACD – Halliburton Company
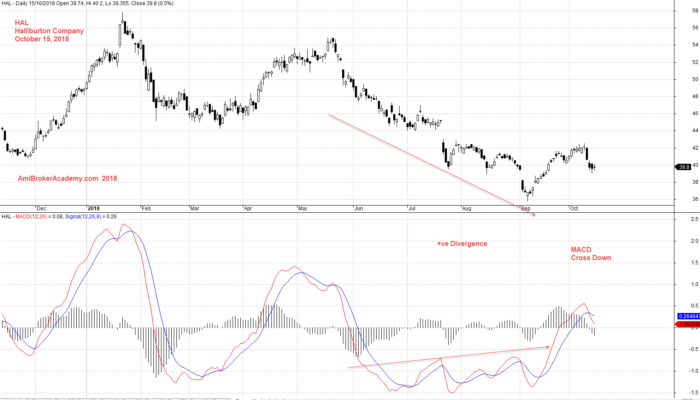
October 15, 2018 Halliburton Company and MACD
If you can see the whole chart, “press Ctrl and -” to zoom out.
Moses U.S. Stock MACD Scan
AmiBroker Academy.com
Disclaimer
The above result is for illustration purpose. It is not meant to be used for buy or sell decision. We do not recommend any particular stocks. If particular stocks of such are mentioned, they are meant as demonstration of Amibroker as a powerful charting software and MACD. Amibroker can program to scan the stocks for buy and sell signals.
These are script generated signals. Not all scan results are shown here. The MACD signal should use with price action. Users must understand what MACD and price action are all about before using them. If necessary you should attend a course to learn more on Technical Analysis (TA) and Moving Average Convergence Divergence, MACD.
Once again, the website does not guarantee any results or investment return based on the information and instruction you have read here. It should be used as learning aids only and if you decide to trade real money, all trading decision should be your own.