15 November, 2018
Thanks for visiting the site.
Free U.S. Stock Five-day MACD Scan
What is MACD?
MACD stands for Moving Average Convergence Divergence, common setting is (12,26,9)
MACD indicator is a trend trading system that makes up of 2 lines. The MACD Line (fast line) and MACD Signal Line (slow line).
1) When the MACD Line crosses over the MACD Signal Line the trend is bullish. When the MACD Line crosses below the MACD Signal the trend is bearish.
2) When the MACD Line crosses above zero line the trend is bullish. When the MACD line crosses below zero line the trend is bearish.
MACD Example – RUT Russell 2000 Index
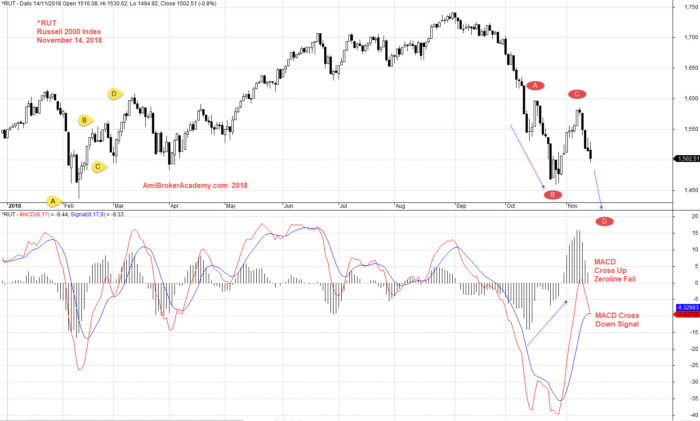
November 14, 2018 Russell 2000 Index and MACD
8 to 14 November 2018 AFL Script Generated Five-day U.S. Stock MACD Signals
The following are script generated Five-day U.S. Stock Market MACD signals using the Powerful AmiBroker’s AFL.
The MACD Setting used is (8,17,9)
| Ticker | Company | Date | Bull/Bear | Close | Vol.(K) | Screening Result |
| AABA | Altaba Inc. | 14/11/2018 | Bull | 62.28 | 9346 | MACD Cross-Up ZeroLine |
| ADNT | Adient plc | 9/11/2018 | Bull | 21.52 | 7539 | MACD +ve Divergence |
| BABA | Alibaba Group Holding Limited | 12/11/2018 | Bull | 142.82 | 16517 | MACD Cross-Up ZeroLine |
| BABA | Alibaba Group Holding Limited | 14/11/2018 | Bull | 150.44 | 21771 | MACD Cross-Up ZeroLine |
| BP | BP p.l.c. | 12/11/2018 | Bull | 40.87 | 5847 | MACD-H +ve Divergence |
| BP | BP p.l.c. | 14/11/2018 | Bull | 40.33 | 8579 | MACD-H +ve Divergence |
| JD | JD.com, Inc. | 8/11/2018 | Bull | 22.4 | 17332 | MACD +ve Divergence |
| JD | JD.com, Inc. | 9/11/2018 | Bull | 21.7 | 17533 | MACD +ve Divergence |
| JD | JD.com, Inc. | 14/11/2018 | Bull | 22.76 | 11820 | MACD +ve Divergence |
| MCHI | iShares MSCI China ETF | 14/11/2018 | Bull | 55.08 | 9419 | MACD Cross-Up ZeroLine |
| MOMO | Momo Inc. | 9/11/2018 | Bull | 32.65 | 5603 | MACD-H +ve Divergence |
| PEG | Public Service Enterprise Group Incorporated | 14/11/2018 | Bull | 53.91 | 5040 | MACD Cross-Up Signal |
| ROKU | Roku, Inc. | 9/11/2018 | Bull | 43.94 | 14371 | MACD-H +ve Divergence |
| ROKU | Roku, Inc. | 14/11/2018 | Bull | 43.2 | 6565 | MACD-H +ve Divergence |
| SU | Suncor Energy Inc. | 14/11/2018 | Bull | 33.41 | 5299 | MACD +ve Divergence |
| TVIX | VelocityShares Daily 2x VIX Short-Term ETN | 8/11/2018 | Bull | 35.96 | 10686 | MACD Cross-Up ZeroLine |
| TVIX | VelocityShares Daily 2x VIX Short-Term ETN | 14/11/2018 | Bull | 47.22 | 18653 | MACD Cross-Up ZeroLine |
| VOD | Vodafone Group Plc | 14/11/2018 | Bull | 20.37 | 14131 | MACD Cross-Up ZeroLine |
| ABT | Abbott Laboratories | 14/11/2018 | Bear | 69.41 | 5351 | MACD Cross-Down Signal |
| BAC | Bank of America Corporation | 8/11/2018 | Bear | 28.87 | 49421 | MACD Cross-Down ZeroLine |
| BAC | Bank of America Corporation | 14/11/2018 | Bear | 27.21 | 69083 | MACD Cross-Down ZeroLine |
| BSX | Boston Scientific Corporation | 14/11/2018 | Bear | 36.21 | 5458 | MACD Cross-Down Signal |
| C | Citigroup Inc. | 14/11/2018 | Bear | 63.5 | 19633 | MACD Cross-Down Signal |
| CELG | Celgene Corporation | 14/11/2018 | Bear | 69.63 | 6941 | MACD Cross-Down Signal |
| CF | CF Industries Holdings, Inc. | 14/11/2018 | Bear | 45.03 | 7804 | MACD Cross-Down Signal |
| CFG | Citizens Financial Group, Inc. | 14/11/2018 | Bear | 36.21 | 8902 | MACD Cross-Down Signal |
| CRM | Salesforce.com Inc | 14/11/2018 | Bear | 129.35 | 5692 | MACD Cross-Down Signal |
| DVN | Devon Energy Corporation | 14/11/2018 | Bear | 30.54 | 7765 | MACD Cross-Down Signal |
| EBAY | eBay Inc. | 14/11/2018 | Bear | 27.89 | 12131 | MACD Cross-Down Signal |
| GLW | Corning Incorporated | 14/11/2018 | Bear | 31.59 | 6917 | MACD Cross-Down Signal |
| GM | General Motors Company | 14/11/2018 | Bear | 35.23 | 10883 | MACD Cross-Down Signal |
| HPQ | HP Inc. | 13/11/2018 | Bear | 23.95 | 7821 | MACD Cross-Down ZeroLine |
| HPQ | HP Inc. | 14/11/2018 | Bear | 23.73 | 9950 | MACD Cross-Down ZeroLine |
| IWM | 8/11/2018 | Bear | 156.99 | 14988 | MACD Cross-Down Signal | |
| IWM | 12/11/2018 | Bear | 151.03 | 21887 | MACD Cross-Down Signal | |
| IWM | 14/11/2018 | Bear | 149.45 | 24514 | MACD Cross-Down Signal | |
| JNPR | Juniper Networks, Inc. | 12/11/2018 | Bear | 28.39 | 5044 | MACD Cross-Down ZeroLine |
| KHC | The Kraft Heinz Company | 13/11/2018 | Bear | 53.38 | 5511 | MACD Cross-Down Signal |
| KHC | The Kraft Heinz Company | 14/11/2018 | Bear | 52.64 | 5599 | MACD Cross-Down Signal |
| KSS | Kohl’s Corporation | 14/11/2018 | Bear | 75.8 | 5835 | MACD Cross-Down Signal |
| M | Macy’s Inc | 14/11/2018 | Bear | 33.22 | 29654 | MACD Cross-Down Signal |
| MSFT | Microsoft Corporation | 8/11/2018 | Bear | 111.75 | 25644 | MACD Cross-Down Signal |
| MSFT | Microsoft Corporation | 13/11/2018 | Bear | 106.94 | 35375 | MACD Cross-Down Signal |
| MSFT | Microsoft Corporation | 14/11/2018 | Bear | 104.97 | 39477 | MACD Cross-Down Signal |
| NBL | Noble Energy Inc. | 14/11/2018 | Bear | 24.74 | 5600 | MACD Cross-Down Signal |
| NFLX | Netflix, Inc. | 14/11/2018 | Bear | 286.73 | 16837 | MACD Cross-Down Signal |
| PFE | Pfizer, Inc. | 8/11/2018 | Bear | 43.85 | 24380 | MACD Cross-Down Signal |
| PFE | Pfizer, Inc. | 14/11/2018 | Bear | 42.91 | 26893 | MACD Cross-Down Signal |
| PGR | Progressive Corporation (The) | 14/11/2018 | Bear | 64.8 | 8963 | MACD Cross-Down Signal |
| PM | Philip Morris International Inc | 14/11/2018 | Bear | 85.5 | 6115 | MACD Cross-Down ZeroLine |
| QQQ | PowerShares QQQ Trust, Series 1 | 14/11/2018 | Bear | 165.2 | 74682 | MACD Cross-Down Signal |
| SO | Southern Company (The) | 12/11/2018 | Bear | 46.89 | 5580 | MACD-H -ve Divergence |
| SO | Southern Company (The) | 14/11/2018 | Bear | 47.4 | 6181 | MACD-H -ve Divergence |
| SQ | Square, Inc. | 8/11/2018 | Bear | 75.23 | 35809 | MACD Cross-Down Signal |
| SQ | Square, Inc. | 14/11/2018 | Bear | 69.81 | 14222 | MACD Cross-Down Signal |
| TQQQ | ProShares UltraPro QQQ | 14/11/2018 | Bear | 47.65 | 19421 | MACD Cross-Down Signal |
| TRU | TransUnion | 14/11/2018 | Bear | 60.47 | 5838 | MACD Cross-Down Signal |
| VLO | Valero Energy Corporation | 14/11/2018 | Bear | 82.34 | 5663 | MACD Cross-Down Signal |
| WBA | Walgreens Boots Alliance, Inc. | 14/11/2018 | Bear | 81.52 | 5360 | MACD Cross-Down Signal |
| WFC | Wells Fargo & Company | 13/11/2018 | Bear | 52.74 | 28102 | MACD Cross-Down ZeroLine |
| WFC | Wells Fargo & Company | 14/11/2018 | Bear | 52.15 | 24762 | MACD Cross-Down ZeroLine |
| WLL | Whiting Petroleum Corporation | 14/11/2018 | Bear | 31.7 | 6120 | MACD Cross-Down Signal |
| XEL | Xcel Energy Inc. | 8/11/2018 | Bear | 49.33 | 10503 | MACD-H -ve Divergence |
| XEL | Xcel Energy Inc. | 14/11/2018 | Bear | 51.16 | 5315 | MACD-H -ve Divergence |
if you can see the full chart, “press Ctrl and -” to zoom out and see the entire chart.
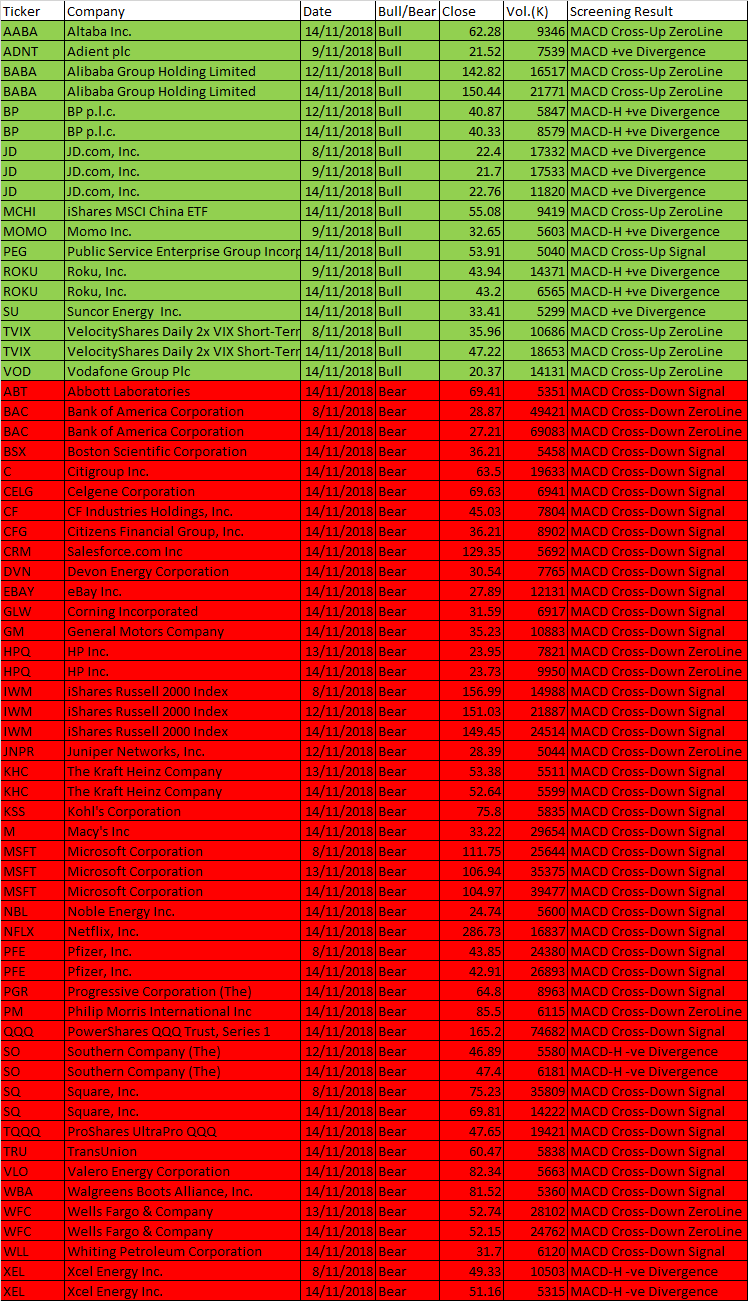
November 8 to 14, 2018 US Stock Five-day MACD Scan Signals
Moses U.S. Stock MACD Scan
AmiBroker Academy.com
Disclaimer
The above result is for illustration purpose. It is not meant to be used for buy or sell decision. We do not recommend any particular stocks. If particular stocks of such are mentioned, they are meant as demonstration of Amibroker as a powerful charting software and MACD. Amibroker can program to scan the stocks for buy and sell signals.
These are script generated signals. Not all scan results are shown here. The MACD signal should use with price action. Users must understand what MACD and price action are all about before using them. If necessary you should attend a course to learn more on Technical Analysis (TA) and Moving Average Convergence Divergence, MACD.
Once again, the website does not guarantee any results or investment return based on the information and instruction you have read here. It should be used as learning aids only and if you decide to trade real money, all trading decision should be your own.