2 December, 2018
Thanks for visiting the site.
Free U.S. Stock Five-day MACD Scan
Wht is AmiBroker AFL?
See the following link https://www.amibroker.com/guide/AFL.html on AmiBroker AFL.
What is MACD?
MACD stands for Moving Average Convergence Divergence, common setting is (12,26,9)
MACD indicator is a trend trading system that makes up of 2 lines. The MACD Line (fast line) and MACD Signal Line (slow line).
1) When the MACD Line crosses over the MACD Signal Line the trend is bullish. When the MACD Line crosses below the MACD Signal the trend is bearish.
2) When the MACD Line crosses above zero line the trend is bullish. When the MACD line crosses below zero line the trend is bearish.
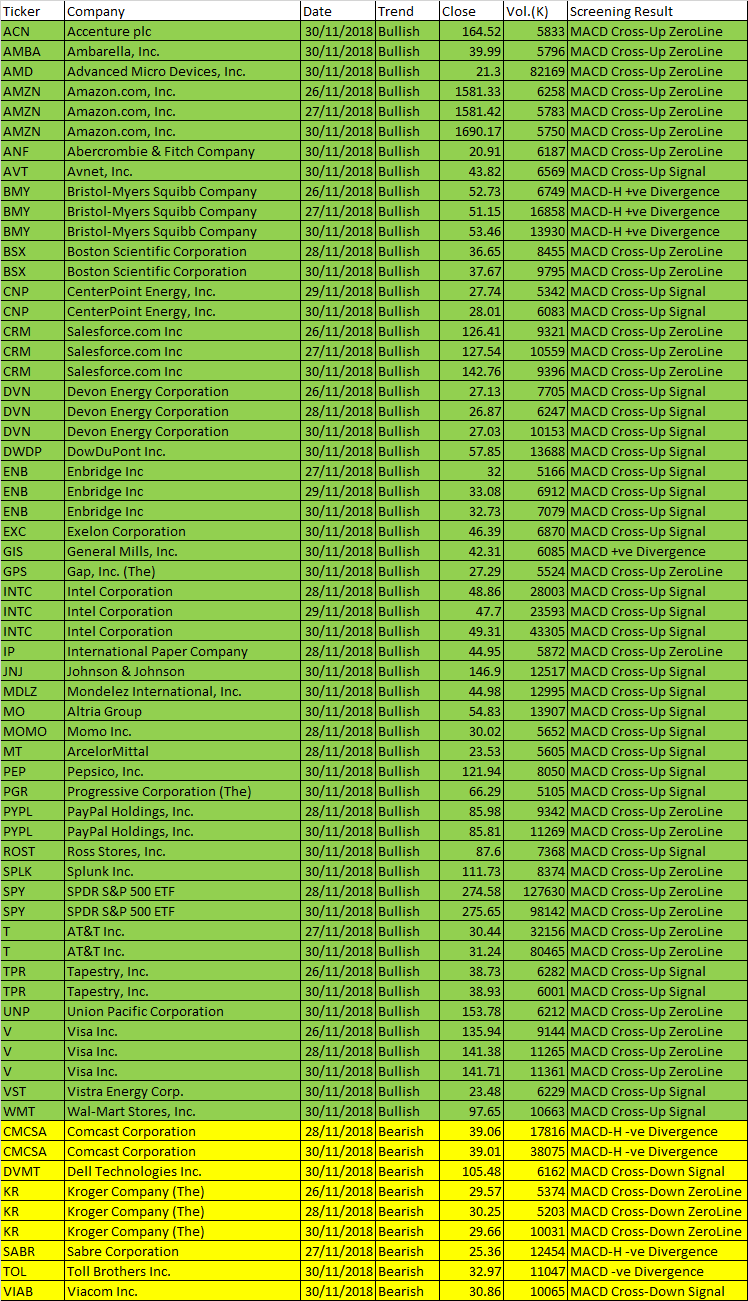
26 to 30 November 2018 AmiBroker AFL Script Generated Five-day U.S. Stock MACD Signals
The following are script generated Five-day U.S. Stock Market MACD signals using the Powerful AmiBroker’s AFL.
The MACD Setting used is (8,17,9)
| Ticker | Company | Date | Trend | Close | Vol.(K) | Screening Result |
| ACN | Accenture plc | 30/11/2018 | Bullish | 164.52 | 5833 | MACD Cross-Up ZeroLine |
| AMBA | Ambarella, Inc. | 30/11/2018 | Bullish | 39.99 | 5796 | MACD Cross-Up ZeroLine |
| AMD | Advanced Micro Devices, Inc. | 30/11/2018 | Bullish | 21.3 | 82169 | MACD Cross-Up ZeroLine |
| AMZN | Amazon.com, Inc. | 26/11/2018 | Bullish | 1581.33 | 6258 | MACD Cross-Up ZeroLine |
| AMZN | Amazon.com, Inc. | 27/11/2018 | Bullish | 1581.42 | 5783 | MACD Cross-Up ZeroLine |
| AMZN | Amazon.com, Inc. | 30/11/2018 | Bullish | 1690.17 | 5750 | MACD Cross-Up ZeroLine |
| ANF | Abercrombie & Fitch Company | 30/11/2018 | Bullish | 20.91 | 6187 | MACD Cross-Up ZeroLine |
| AVT | Avnet, Inc. | 30/11/2018 | Bullish | 43.82 | 6569 | MACD Cross-Up Signal |
| BMY | Bristol-Myers Squibb Company | 26/11/2018 | Bullish | 52.73 | 6749 | MACD-H +ve Divergence |
| BMY | Bristol-Myers Squibb Company | 27/11/2018 | Bullish | 51.15 | 16858 | MACD-H +ve Divergence |
| BMY | Bristol-Myers Squibb Company | 30/11/2018 | Bullish | 53.46 | 13930 | MACD-H +ve Divergence |
| BSX | Boston Scientific Corporation | 28/11/2018 | Bullish | 36.65 | 8455 | MACD Cross-Up ZeroLine |
| BSX | Boston Scientific Corporation | 30/11/2018 | Bullish | 37.67 | 9795 | MACD Cross-Up ZeroLine |
| CNP | CenterPoint Energy, Inc. | 29/11/2018 | Bullish | 27.74 | 5342 | MACD Cross-Up Signal |
| CNP | CenterPoint Energy, Inc. | 30/11/2018 | Bullish | 28.01 | 6083 | MACD Cross-Up Signal |
| CRM | Salesforce.com Inc | 26/11/2018 | Bullish | 126.41 | 9321 | MACD Cross-Up ZeroLine |
| CRM | Salesforce.com Inc | 27/11/2018 | Bullish | 127.54 | 10559 | MACD Cross-Up ZeroLine |
| CRM | Salesforce.com Inc | 30/11/2018 | Bullish | 142.76 | 9396 | MACD Cross-Up ZeroLine |
| DVN | Devon Energy Corporation | 26/11/2018 | Bullish | 27.13 | 7705 | MACD Cross-Up Signal |
| DVN | Devon Energy Corporation | 28/11/2018 | Bullish | 26.87 | 6247 | MACD Cross-Up Signal |
| DVN | Devon Energy Corporation | 30/11/2018 | Bullish | 27.03 | 10153 | MACD Cross-Up Signal |
| DWDP | DowDuPont Inc. | 30/11/2018 | Bullish | 57.85 | 13688 | MACD Cross-Up Signal |
| ENB | Enbridge Inc | 27/11/2018 | Bullish | 32 | 5166 | MACD Cross-Up Signal |
| ENB | Enbridge Inc | 29/11/2018 | Bullish | 33.08 | 6912 | MACD Cross-Up Signal |
| ENB | Enbridge Inc | 30/11/2018 | Bullish | 32.73 | 7079 | MACD Cross-Up Signal |
| EXC | Exelon Corporation | 30/11/2018 | Bullish | 46.39 | 6870 | MACD Cross-Up Signal |
| GIS | General Mills, Inc. | 30/11/2018 | Bullish | 42.31 | 6085 | MACD +ve Divergence |
| GPS | Gap, Inc. (The) | 30/11/2018 | Bullish | 27.29 | 5524 | MACD Cross-Up ZeroLine |
| INTC | Intel Corporation | 28/11/2018 | Bullish | 48.86 | 28003 | MACD Cross-Up Signal |
| INTC | Intel Corporation | 29/11/2018 | Bullish | 47.7 | 23593 | MACD Cross-Up Signal |
| INTC | Intel Corporation | 30/11/2018 | Bullish | 49.31 | 43305 | MACD Cross-Up Signal |
| IP | International Paper Company | 28/11/2018 | Bullish | 44.95 | 5872 | MACD Cross-Up ZeroLine |
| JNJ | Johnson & Johnson | 30/11/2018 | Bullish | 146.9 | 12517 | MACD Cross-Up Signal |
| MDLZ | Mondelez International, Inc. | 30/11/2018 | Bullish | 44.98 | 12995 | MACD Cross-Up Signal |
| MO | Altria Group | 30/11/2018 | Bullish | 54.83 | 13907 | MACD Cross-Up Signal |
| MOMO | Momo Inc. | 28/11/2018 | Bullish | 30.02 | 5652 | MACD Cross-Up Signal |
| MT | ArcelorMittal | 28/11/2018 | Bullish | 23.53 | 5605 | MACD Cross-Up Signal |
| PEP | Pepsico, Inc. | 30/11/2018 | Bullish | 121.94 | 8050 | MACD Cross-Up Signal |
| PGR | Progressive Corporation (The) | 30/11/2018 | Bullish | 66.29 | 5105 | MACD Cross-Up Signal |
| PYPL | PayPal Holdings, Inc. | 28/11/2018 | Bullish | 85.98 | 9342 | MACD Cross-Up ZeroLine |
| PYPL | PayPal Holdings, Inc. | 30/11/2018 | Bullish | 85.81 | 11269 | MACD Cross-Up ZeroLine |
| ROST | Ross Stores, Inc. | 30/11/2018 | Bullish | 87.6 | 7368 | MACD Cross-Up Signal |
| SPLK | Splunk Inc. | 30/11/2018 | Bullish | 111.73 | 8374 | MACD Cross-Up ZeroLine |
| SPY | SPDR S&P 500 ETF | 28/11/2018 | Bullish | 274.58 | 127630 | MACD Cross-Up ZeroLine |
| SPY | SPDR S&P 500 ETF | 30/11/2018 | Bullish | 275.65 | 98142 | MACD Cross-Up ZeroLine |
| T | AT&T Inc. | 27/11/2018 | Bullish | 30.44 | 32156 | MACD Cross-Up ZeroLine |
| T | AT&T Inc. | 30/11/2018 | Bullish | 31.24 | 80465 | MACD Cross-Up ZeroLine |
| TPR | Tapestry, Inc. | 26/11/2018 | Bullish | 38.73 | 6282 | MACD Cross-Up Signal |
| TPR | Tapestry, Inc. | 30/11/2018 | Bullish | 38.93 | 6001 | MACD Cross-Up Signal |
| UNP | Union Pacific Corporation | 30/11/2018 | Bullish | 153.78 | 6212 | MACD Cross-Up ZeroLine |
| V | Visa Inc. | 26/11/2018 | Bullish | 135.94 | 9144 | MACD Cross-Up ZeroLine |
| V | Visa Inc. | 28/11/2018 | Bullish | 141.38 | 11265 | MACD Cross-Up ZeroLine |
| V | Visa Inc. | 30/11/2018 | Bullish | 141.71 | 11361 | MACD Cross-Up ZeroLine |
| VST | Vistra Energy Corp. | 30/11/2018 | Bullish | 23.48 | 6229 | MACD Cross-Up Signal |
| WMT | Wal-Mart Stores, Inc. | 30/11/2018 | Bullish | 97.65 | 10663 | MACD Cross-Up Signal |
| CMCSA | Comcast Corporation | 28/11/2018 | Bearish | 39.06 | 17816 | MACD-H -ve Divergence |
| CMCSA | Comcast Corporation | 30/11/2018 | Bearish | 39.01 | 38075 | MACD-H -ve Divergence |
| DVMT | Dell Technologies Inc. | 30/11/2018 | Bearish | 105.48 | 6162 | MACD Cross-Down Signal |
| KR | Kroger Company (The) | 26/11/2018 | Bearish | 29.57 | 5374 | MACD Cross-Down ZeroLine |
| KR | Kroger Company (The) | 28/11/2018 | Bearish | 30.25 | 5203 | MACD Cross-Down ZeroLine |
| KR | Kroger Company (The) | 30/11/2018 | Bearish | 29.66 | 10031 | MACD Cross-Down ZeroLine |
| SABR | Sabre Corporation | 27/11/2018 | Bearish | 25.36 | 12454 | MACD-H -ve Divergence |
| TOL | Toll Brothers Inc. | 30/11/2018 | Bearish | 32.97 | 11047 | MACD -ve Divergence |
| VIAB | Viacom Inc. | 30/11/2018 | Bearish | 30.86 | 10065 | MACD Cross-Down Signal |
November 26 to 30, 2018 US Stock Five-day MACD Signals
if you can see the full chart, “press Ctrl and -” to zoom out and see the entire chart.
Moses U.S. Stock MACD Scan
AmiBroker Academy.com
Disclaimer
The above result is for illustration purpose. It is not meant to be used for buy or sell decision. We do not recommend any particular stocks. If particular stocks of such are mentioned, they are meant as demonstration of Amibroker as a powerful charting software and MACD. Amibroker can program to scan the stocks for buy and sell signals.
These are script generated signals. Not all scan results are shown here. The MACD signal should use with price action. Users must understand what MACD and price action are all about before using them. If necessary you should attend a course to learn more on Technical Analysis (TA) and Moving Average Convergence Divergence, MACD.
Once again, the website does not guarantee any results or investment return based on the information and instruction you have read here. It should be used as learning aids only and if you decide to trade real money, all trading decision should be your own.