13 April, 2019
Thanks for visiting the site.
Free U.S. Stock Five-day MACD Scan
Wht is AmiBroker AFL?
See the following link https://www.amibroker.com/guide/AFL.html on AmiBroker AFL.
What is MACD?
MACD stands for Moving Average Convergence Divergence, common setting is (12,26,9)
MACD indicator is a trend trading system that makes up of 2 lines. The MACD Line (fast line) and MACD Signal Line (slow line).
1) When the MACD Line crosses over the MACD Signal Line the trend is bullish. When the MACD Line crosses below the MACD Signal the trend is bearish.
2) When the MACD Line crosses above zero line the trend is bullish. When the MACD line crosses below zero line the trend is bearish.
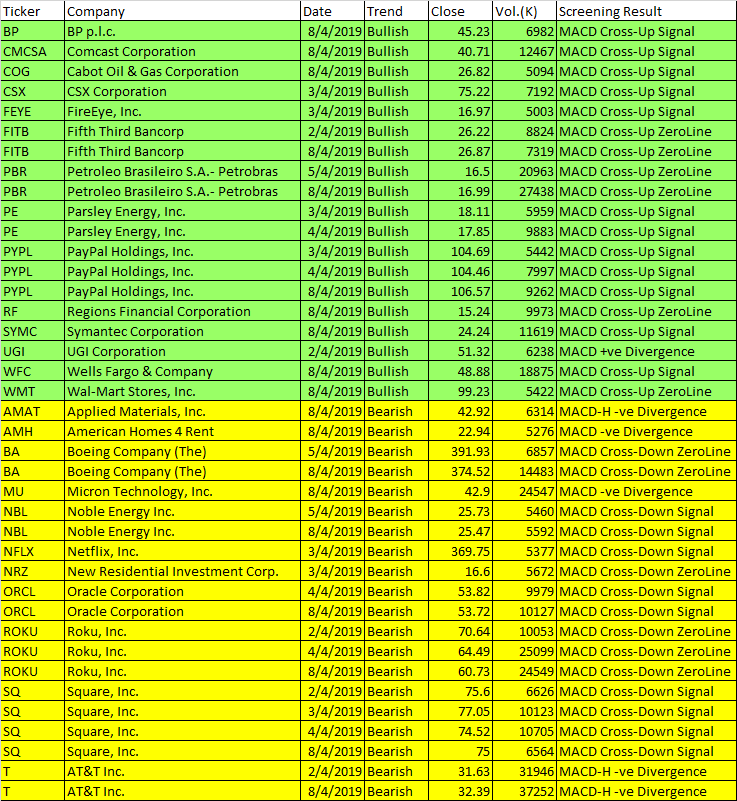
2 to 8 April 2019 AmiBroker AFL Script Generated Five-day U.S. Stock MACD Signals
The following are script generated Five-day U.S. Stock Market MACD signals using the Powerful AmiBroker’s AFL.
The MACD Setting used is (8,17,9)
| Ticker | Company | Date | Trend | Close | Vol.(K) | Screening Result |
| BP | BP p.l.c. | 8/4/2019 | Bullish | 45.23 | 6982 | MACD Cross-Up Signal |
| CMCSA | Comcast Corporation | 8/4/2019 | Bullish | 40.71 | 12467 | MACD Cross-Up Signal |
| COG | Cabot Oil & Gas Corporation | 8/4/2019 | Bullish | 26.82 | 5094 | MACD Cross-Up Signal |
| CSX | CSX Corporation | 3/4/2019 | Bullish | 75.22 | 7192 | MACD Cross-Up Signal |
| FEYE | FireEye, Inc. | 3/4/2019 | Bullish | 16.97 | 5003 | MACD Cross-Up Signal |
| FITB | Fifth Third Bancorp | 2/4/2019 | Bullish | 26.22 | 8824 | MACD Cross-Up ZeroLine |
| FITB | Fifth Third Bancorp | 8/4/2019 | Bullish | 26.87 | 7319 | MACD Cross-Up ZeroLine |
| PBR | Petroleo Brasileiro S.A.- Petrobras | 5/4/2019 | Bullish | 16.5 | 20963 | MACD Cross-Up ZeroLine |
| PBR | Petroleo Brasileiro S.A.- Petrobras | 8/4/2019 | Bullish | 16.99 | 27438 | MACD Cross-Up ZeroLine |
| PE | Parsley Energy, Inc. | 3/4/2019 | Bullish | 18.11 | 5959 | MACD Cross-Up Signal |
| PE | Parsley Energy, Inc. | 4/4/2019 | Bullish | 17.85 | 9883 | MACD Cross-Up Signal |
| PYPL | PayPal Holdings, Inc. | 3/4/2019 | Bullish | 104.69 | 5442 | MACD Cross-Up Signal |
| PYPL | PayPal Holdings, Inc. | 4/4/2019 | Bullish | 104.46 | 7997 | MACD Cross-Up Signal |
| PYPL | PayPal Holdings, Inc. | 8/4/2019 | Bullish | 106.57 | 9262 | MACD Cross-Up Signal |
| RF | Regions Financial Corporation | 8/4/2019 | Bullish | 15.24 | 9973 | MACD Cross-Up ZeroLine |
| SYMC | Symantec Corporation | 8/4/2019 | Bullish | 24.24 | 11619 | MACD Cross-Up Signal |
| UGI | UGI Corporation | 2/4/2019 | Bullish | 51.32 | 6238 | MACD +ve Divergence |
| WFC | Wells Fargo & Company | 8/4/2019 | Bullish | 48.88 | 18875 | MACD Cross-Up Signal |
| WMT | Wal-Mart Stores, Inc. | 8/4/2019 | Bullish | 99.23 | 5422 | MACD Cross-Up ZeroLine |
| AMAT | Applied Materials, Inc. | 8/4/2019 | Bearish | 42.92 | 6314 | MACD-H -ve Divergence |
| AMH | American Homes 4 Rent | 8/4/2019 | Bearish | 22.94 | 5276 | MACD -ve Divergence |
| BA | Boeing Company (The) | 5/4/2019 | Bearish | 391.93 | 6857 | MACD Cross-Down ZeroLine |
| BA | Boeing Company (The) | 8/4/2019 | Bearish | 374.52 | 14483 | MACD Cross-Down ZeroLine |
| MU | Micron Technology, Inc. | 8/4/2019 | Bearish | 42.9 | 24547 | MACD -ve Divergence |
| NBL | Noble Energy Inc. | 5/4/2019 | Bearish | 25.73 | 5460 | MACD Cross-Down Signal |
| NBL | Noble Energy Inc. | 8/4/2019 | Bearish | 25.47 | 5592 | MACD Cross-Down Signal |
| NFLX | Netflix, Inc. | 3/4/2019 | Bearish | 369.75 | 5377 | MACD Cross-Down Signal |
| NRZ | New Residential Investment Corp. | 3/4/2019 | Bearish | 16.6 | 5672 | MACD Cross-Down ZeroLine |
| ORCL | Oracle Corporation | 4/4/2019 | Bearish | 53.82 | 9979 | MACD Cross-Down Signal |
| ORCL | Oracle Corporation | 8/4/2019 | Bearish | 53.72 | 10127 | MACD Cross-Down Signal |
| ROKU | Roku, Inc. | 2/4/2019 | Bearish | 70.64 | 10053 | MACD Cross-Down ZeroLine |
| ROKU | Roku, Inc. | 4/4/2019 | Bearish | 64.49 | 25099 | MACD Cross-Down ZeroLine |
| ROKU | Roku, Inc. | 8/4/2019 | Bearish | 60.73 | 24549 | MACD Cross-Down ZeroLine |
| SQ | Square, Inc. | 2/4/2019 | Bearish | 75.6 | 6626 | MACD Cross-Down Signal |
| SQ | Square, Inc. | 3/4/2019 | Bearish | 77.05 | 10123 | MACD Cross-Down Signal |
| SQ | Square, Inc. | 4/4/2019 | Bearish | 74.52 | 10705 | MACD Cross-Down Signal |
| SQ | Square, Inc. | 8/4/2019 | Bearish | 75 | 6564 | MACD Cross-Down Signal |
| T | AT&T Inc. | 2/4/2019 | Bearish | 31.63 | 31946 | MACD-H -ve Divergence |
| T | AT&T Inc. | 8/4/2019 | Bearish | 32.39 | 37252 | MACD-H -ve Divergence |
Moses U.S. Stock MACD Scan
AmiBroker Academy.com
Disclaimer
The above result is for illustration purpose. It is not meant to be used for buy or sell decision. We do not recommend any particular stocks. If particular stocks of such are mentioned, they are meant as demonstration of Amibroker as a powerful charting software and MACD. Amibroker can program to scan the stocks for buy and sell signals.
These are script generated signals. Not all scan results are shown here. The MACD signal should use with price action. Users must understand what MACD and price action are all about before using them. If necessary you should attend a course to learn more on Technical Analysis (TA) and Moving Average Convergence Divergence, MACD.
Once again, the website does not guarantee any results or investment return based on the information and instruction you have read here. It should be used as learning aids only and if you decide to trade real money, all trading decision should be your own.