9 January, 2019
Thanks for visiting the site.
Free U.S. Stock Five-day MACD Scan
Wht is AmiBroker AFL?
See the following link https://www.amibroker.com/guide/AFL.html on AmiBroker AFL.
What is MACD?
MACD stands for Moving Average Convergence Divergence, common setting is (12,26,9)
MACD indicator is a trend trading system that makes up of 2 lines. The MACD Line (fast line) and MACD Signal Line (slow line).
1) When the MACD Line crosses over the MACD Signal Line the trend is bullish. When the MACD Line crosses below the MACD Signal the trend is bearish.
2) When the MACD Line crosses above zero line the trend is bullish. When the MACD line crosses below zero line the trend is bearish.
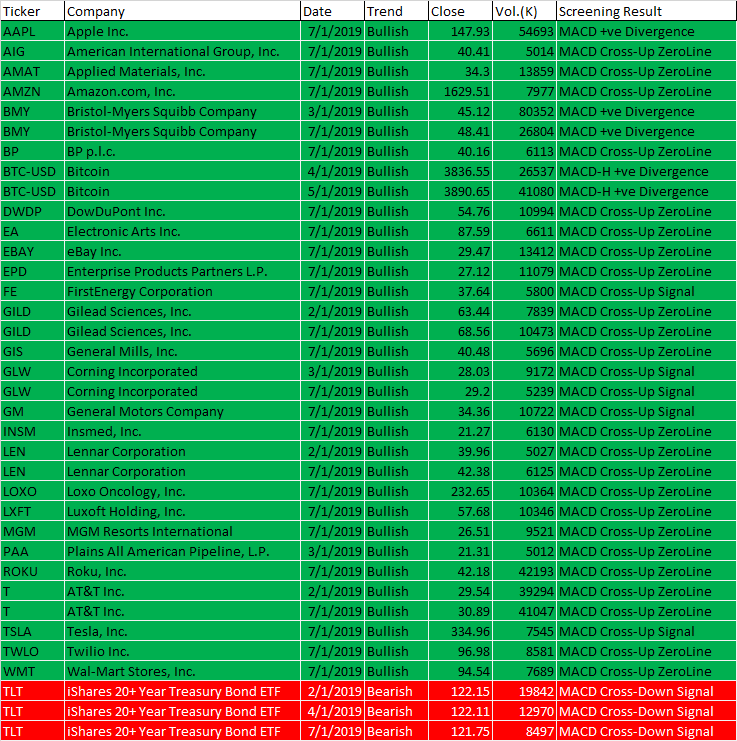
1 to 7 January 2019 AmiBroker AFL Script Generated Five-day U.S. Stock MACD Signals
The following are script generated Five-day U.S. Stock Market MACD signals using the Powerful AmiBroker’s AFL.
The MACD Setting used is (8,17,9)
| Ticker | Company | Date | Trend | Close | Vol.(K) | Screening Result |
| AAPL | Apple Inc. | 7/1/2019 | Bullish | 147.93 | 54693 | MACD +ve Divergence |
| AIG | American International Group, Inc. | 7/1/2019 | Bullish | 40.41 | 5014 | MACD Cross-Up ZeroLine |
| AMAT | Applied Materials, Inc. | 7/1/2019 | Bullish | 34.3 | 13859 | MACD Cross-Up ZeroLine |
| AMZN | Amazon.com, Inc. | 7/1/2019 | Bullish | 1629.51 | 7977 | MACD Cross-Up ZeroLine |
| BMY | Bristol-Myers Squibb Company | 3/1/2019 | Bullish | 45.12 | 80352 | MACD +ve Divergence |
| BMY | Bristol-Myers Squibb Company | 7/1/2019 | Bullish | 48.41 | 26804 | MACD +ve Divergence |
| BP | BP p.l.c. | 7/1/2019 | Bullish | 40.16 | 6113 | MACD Cross-Up ZeroLine |
| BTC-USD | Bitcoin | 4/1/2019 | Bullish | 3836.55 | 26537 | MACD-H +ve Divergence |
| BTC-USD | Bitcoin | 5/1/2019 | Bullish | 3890.65 | 41080 | MACD-H +ve Divergence |
| DWDP | DowDuPont Inc. | 7/1/2019 | Bullish | 54.76 | 10994 | MACD Cross-Up ZeroLine |
| EA | Electronic Arts Inc. | 7/1/2019 | Bullish | 87.59 | 6611 | MACD Cross-Up ZeroLine |
| EBAY | eBay Inc. | 7/1/2019 | Bullish | 29.47 | 13412 | MACD Cross-Up ZeroLine |
| EPD | Enterprise Products Partners L.P. | 7/1/2019 | Bullish | 27.12 | 11079 | MACD Cross-Up ZeroLine |
| FE | FirstEnergy Corporation | 7/1/2019 | Bullish | 37.64 | 5800 | MACD Cross-Up Signal |
| GILD | Gilead Sciences, Inc. | 2/1/2019 | Bullish | 63.44 | 7839 | MACD Cross-Up ZeroLine |
| GILD | Gilead Sciences, Inc. | 7/1/2019 | Bullish | 68.56 | 10473 | MACD Cross-Up ZeroLine |
| GIS | General Mills, Inc. | 7/1/2019 | Bullish | 40.48 | 5696 | MACD Cross-Up ZeroLine |
| GLW | Corning Incorporated | 3/1/2019 | Bullish | 28.03 | 9172 | MACD Cross-Up Signal |
| GLW | Corning Incorporated | 7/1/2019 | Bullish | 29.2 | 5239 | MACD Cross-Up Signal |
| GM | General Motors Company | 7/1/2019 | Bullish | 34.36 | 10722 | MACD Cross-Up Signal |
| INSM | Insmed, Inc. | 7/1/2019 | Bullish | 21.27 | 6130 | MACD Cross-Up ZeroLine |
| LEN | Lennar Corporation | 2/1/2019 | Bullish | 39.96 | 5027 | MACD Cross-Up ZeroLine |
| LEN | Lennar Corporation | 7/1/2019 | Bullish | 42.38 | 6125 | MACD Cross-Up ZeroLine |
| LOXO | Loxo Oncology, Inc. | 7/1/2019 | Bullish | 232.65 | 10364 | MACD Cross-Up ZeroLine |
| LXFT | Luxoft Holding, Inc. | 7/1/2019 | Bullish | 57.68 | 10346 | MACD Cross-Up ZeroLine |
| MGM | MGM Resorts International | 7/1/2019 | Bullish | 26.51 | 9521 | MACD Cross-Up ZeroLine |
| PAA | Plains All American Pipeline, L.P. | 3/1/2019 | Bullish | 21.31 | 5012 | MACD Cross-Up ZeroLine |
| ROKU | Roku, Inc. | 7/1/2019 | Bullish | 42.18 | 42193 | MACD Cross-Up ZeroLine |
| T | AT&T Inc. | 2/1/2019 | Bullish | 29.54 | 39294 | MACD Cross-Up ZeroLine |
| T | AT&T Inc. | 7/1/2019 | Bullish | 30.89 | 41047 | MACD Cross-Up ZeroLine |
| TSLA | Tesla, Inc. | 7/1/2019 | Bullish | 334.96 | 7545 | MACD Cross-Up Signal |
| TWLO | Twilio Inc. | 7/1/2019 | Bullish | 96.98 | 8581 | MACD Cross-Up ZeroLine |
| WMT | Wal-Mart Stores, Inc. | 7/1/2019 | Bullish | 94.54 | 7689 | MACD Cross-Up ZeroLine |
| TLT | iShares 20+ Year Treasury Bond ETF | 2/1/2019 | Bearish | 122.15 | 19842 | MACD Cross-Down Signal |
| TLT | iShares 20+ Year Treasury Bond ETF | 4/1/2019 | Bearish | 122.11 | 12970 | MACD Cross-Down Signal |
| TLT | iShares 20+ Year Treasury Bond ETF | 7/1/2019 | Bearish | 121.75 | 8497 | MACD Cross-Down Signal |
Moses U.S. Stock MACD Scan
AmiBroker Academy.com
Disclaimer
The above result is for illustration purpose. It is not meant to be used for buy or sell decision. We do not recommend any particular stocks. If particular stocks of such are mentioned, they are meant as demonstration of Amibroker as a powerful charting software and MACD. Amibroker can program to scan the stocks for buy and sell signals.
These are script generated signals. Not all scan results are shown here. The MACD signal should use with price action. Users must understand what MACD and price action are all about before using them. If necessary you should attend a course to learn more on Technical Analysis (TA) and Moving Average Convergence Divergence, MACD.
Once again, the website does not guarantee any results or investment return based on the information and instruction you have read here. It should be used as learning aids only and if you decide to trade real money, all trading decision should be your own.