2 October, 2018
Thanks for visiting the site.
Free U.S. Stock MACD Scan
What is MACD?
MACD stands for Moving Average Convergence Divergence, common setting is (12,26,9)
MACD indicator is a trend trading system that makes up of 2 lines. The MACD Line (fast line) and MACD Signal Line (slow line).
1) When the MACD Line crosses over the MACD Signal Line the trend is bullish. When the MACD Line crosses below the MACD Signal the trend is bearish.
2) When the MACD Line crosses above zero line the trend is bullish. When the MACD line crosses below zero line the trend is bearish.
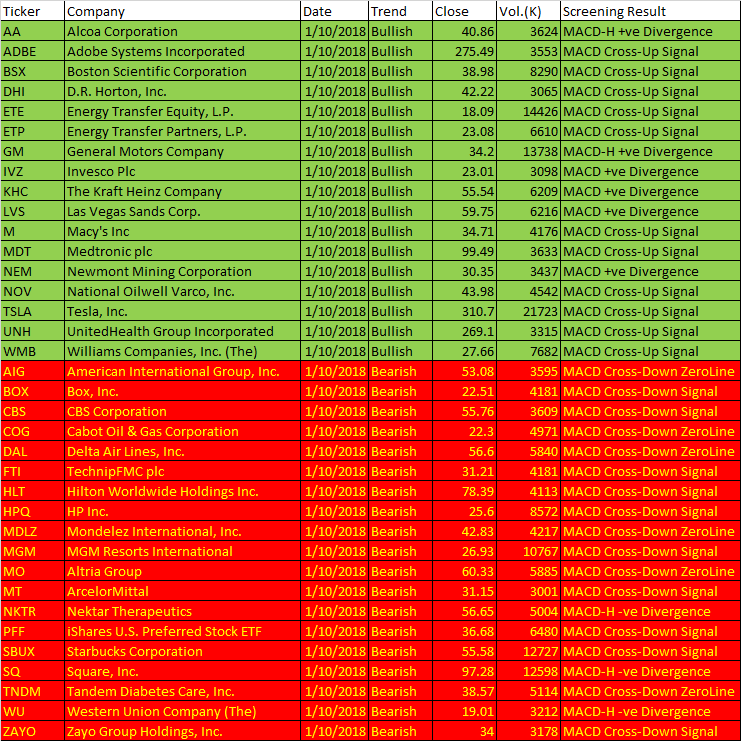
October 1 2018 – Script Generated One-day U.S. Stock MACD Signals
The following are script generated One-day U.S. Stock Market MACD signals using the Powerful AmiBroker’s AFL.
The MACD Setting used is (8,17,9)
| Ticker | Company | Date | Trend | Close | Vol.(K) | Screening Result |
| AA | Alcoa Corporation | 1/10/2018 | Bullish | 40.86 | 3624 | MACD-H +ve Divergence |
| ADBE | Adobe Systems Incorporated | 1/10/2018 | Bullish | 275.49 | 3553 | MACD Cross-Up Signal |
| BSX | Boston Scientific Corporation | 1/10/2018 | Bullish | 38.98 | 8290 | MACD Cross-Up Signal |
| DHI | D.R. Horton, Inc. | 1/10/2018 | Bullish | 42.22 | 3065 | MACD Cross-Up Signal |
| ETE | Energy Transfer Equity, L.P. | 1/10/2018 | Bullish | 18.09 | 14426 | MACD Cross-Up Signal |
| ETP | Energy Transfer Partners, L.P. | 1/10/2018 | Bullish | 23.08 | 6610 | MACD Cross-Up Signal |
| GM | General Motors Company | 1/10/2018 | Bullish | 34.2 | 13738 | MACD-H +ve Divergence |
| IVZ | Invesco Plc | 1/10/2018 | Bullish | 23.01 | 3098 | MACD +ve Divergence |
| KHC | The Kraft Heinz Company | 1/10/2018 | Bullish | 55.54 | 6209 | MACD +ve Divergence |
| LVS | Las Vegas Sands Corp. | 1/10/2018 | Bullish | 59.75 | 6216 | MACD +ve Divergence |
| M | Macy’s Inc | 1/10/2018 | Bullish | 34.71 | 4176 | MACD Cross-Up Signal |
| MDT | Medtronic plc | 1/10/2018 | Bullish | 99.49 | 3633 | MACD Cross-Up Signal |
| NEM | Newmont Mining Corporation | 1/10/2018 | Bullish | 30.35 | 3437 | MACD +ve Divergence |
| NOV | National Oilwell Varco, Inc. | 1/10/2018 | Bullish | 43.98 | 4542 | MACD Cross-Up Signal |
| TSLA | Tesla, Inc. | 1/10/2018 | Bullish | 310.7 | 21723 | MACD Cross-Up Signal |
| UNH | UnitedHealth Group Incorporated | 1/10/2018 | Bullish | 269.1 | 3315 | MACD Cross-Up Signal |
| WMB | Williams Companies, Inc. (The) | 1/10/2018 | Bullish | 27.66 | 7682 | MACD Cross-Up Signal |
| AIG | American International Group, Inc. | 1/10/2018 | Bearish | 53.08 | 3595 | MACD Cross-Down ZeroLine |
| BOX | Box, Inc. | 1/10/2018 | Bearish | 22.51 | 4181 | MACD Cross-Down Signal |
| CBS | CBS Corporation | 1/10/2018 | Bearish | 55.76 | 3609 | MACD Cross-Down Signal |
| COG | Cabot Oil & Gas Corporation | 1/10/2018 | Bearish | 22.3 | 4971 | MACD Cross-Down ZeroLine |
| DAL | Delta Air Lines, Inc. | 1/10/2018 | Bearish | 56.6 | 5840 | MACD Cross-Down ZeroLine |
| FTI | TechnipFMC plc | 1/10/2018 | Bearish | 31.21 | 4181 | MACD Cross-Down Signal |
| HLT | Hilton Worldwide Holdings Inc. | 1/10/2018 | Bearish | 78.39 | 4113 | MACD Cross-Down Signal |
| HPQ | HP Inc. | 1/10/2018 | Bearish | 25.6 | 8572 | MACD Cross-Down Signal |
| MDLZ | Mondelez International, Inc. | 1/10/2018 | Bearish | 42.83 | 4217 | MACD Cross-Down ZeroLine |
| MGM | MGM Resorts International | 1/10/2018 | Bearish | 26.93 | 10767 | MACD Cross-Down Signal |
| MO | Altria Group | 1/10/2018 | Bearish | 60.33 | 5885 | MACD Cross-Down ZeroLine |
| MT | ArcelorMittal | 1/10/2018 | Bearish | 31.15 | 3001 | MACD Cross-Down Signal |
| NKTR | Nektar Therapeutics | 1/10/2018 | Bearish | 56.65 | 5004 | MACD-H -ve Divergence |
| PFF | iShares U.S. Preferred Stock ETF | 1/10/2018 | Bearish | 36.68 | 6480 | MACD Cross-Down Signal |
| SBUX | Starbucks Corporation | 1/10/2018 | Bearish | 55.58 | 12727 | MACD Cross-Down Signal |
| SQ | Square, Inc. | 1/10/2018 | Bearish | 97.28 | 12598 | MACD-H -ve Divergence |
| TNDM | Tandem Diabetes Care, Inc. | 1/10/2018 | Bearish | 38.57 | 5114 | MACD Cross-Down ZeroLine |
| WU | Western Union Company (The) | 1/10/2018 | Bearish | 19.01 | 3212 | MACD-H -ve Divergence |
| ZAYO | Zayo Group Holdings, Inc. | 1/10/2018 | Bearish | 34 | 3178 | MACD Cross-Down Signal |
MACD Example – The Kraft Heinz Company
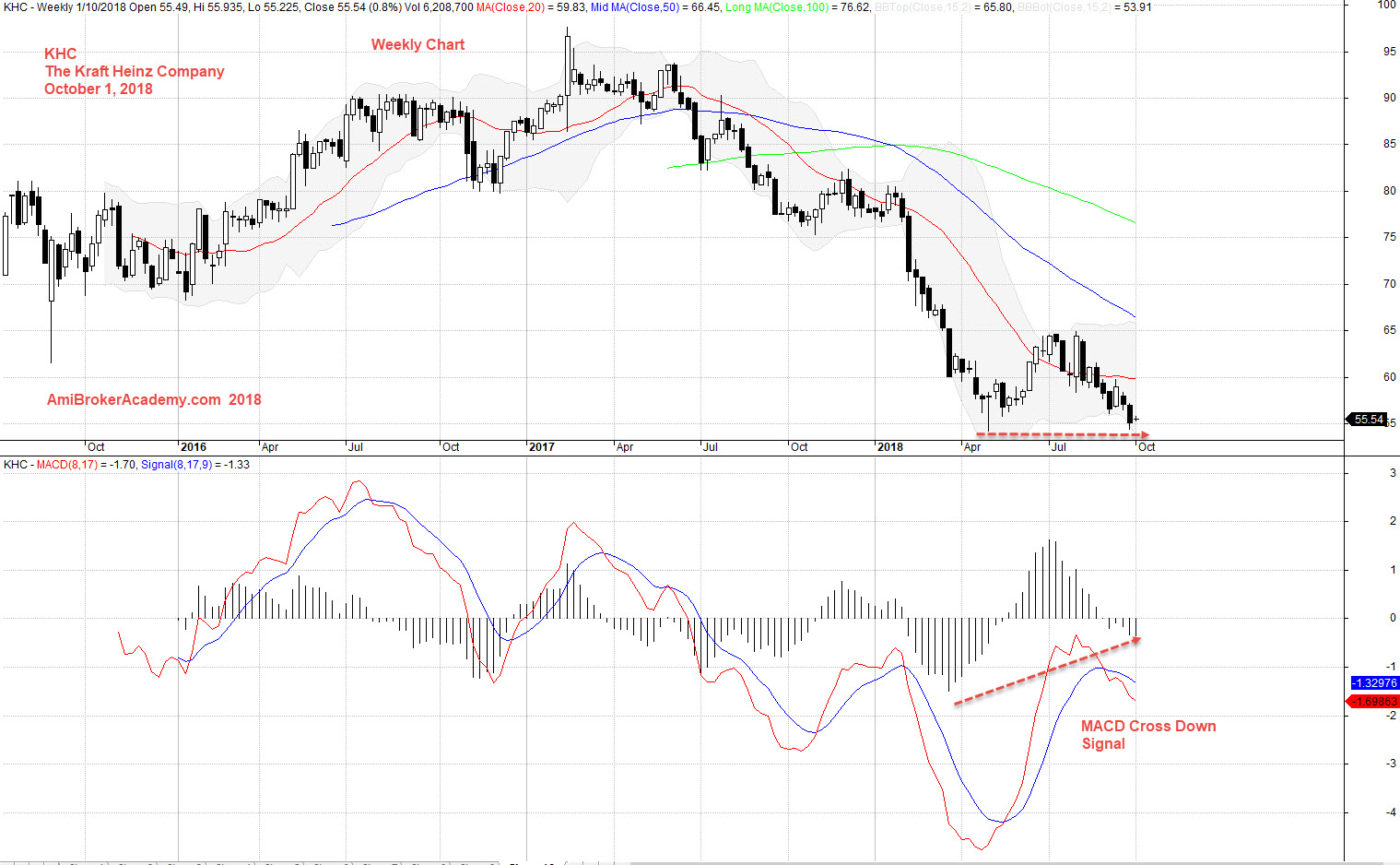
October 1, 2018 The Kraft Heinz Company and MACD
October 1, 2018 US Stock One-day MACD Signals
Moses U.S. Stock MACD Scan
AmiBroker Academy.com
Disclaimer
The above result is for illustration purpose. It is not meant to be used for buy or sell decision. We do not recommend any particular stocks. If particular stocks of such are mentioned, they are meant as demonstration of Amibroker as a powerful charting software and MACD. Amibroker can program to scan the stocks for buy and sell signals.
These are script generated signals. Not all scan results are shown here. The MACD signal should use with price action. Users must understand what MACD and price action are all about before using them. If necessary you should attend a course to learn more on Technical Analysis (TA) and Moving Average Convergence Divergence, MACD.
Once again, the website does not guarantee any results or investment return based on the information and instruction you have read here. It should be used as learning aids only and if you decide to trade real money, all trading decision should be your own.