24 February, 2019
Thanks for visiting the site.
Free U.S. Stock Five-day MACD Scan
Wht is AmiBroker AFL?
See the following link https://www.amibroker.com/guide/AFL.html on AmiBroker AFL.
What is MACD?
MACD stands for Moving Average Convergence Divergence, common setting is (12,26,9)
MACD indicator is a trend trading system that makes up of 2 lines. The MACD Line (fast line) and MACD Signal Line (slow line).
1) When the MACD Line crosses over the MACD Signal Line the trend is bullish. When the MACD Line crosses below the MACD Signal the trend is bearish.
2) When the MACD Line crosses above zero line the trend is bullish. When the MACD line crosses below zero line the trend is bearish.
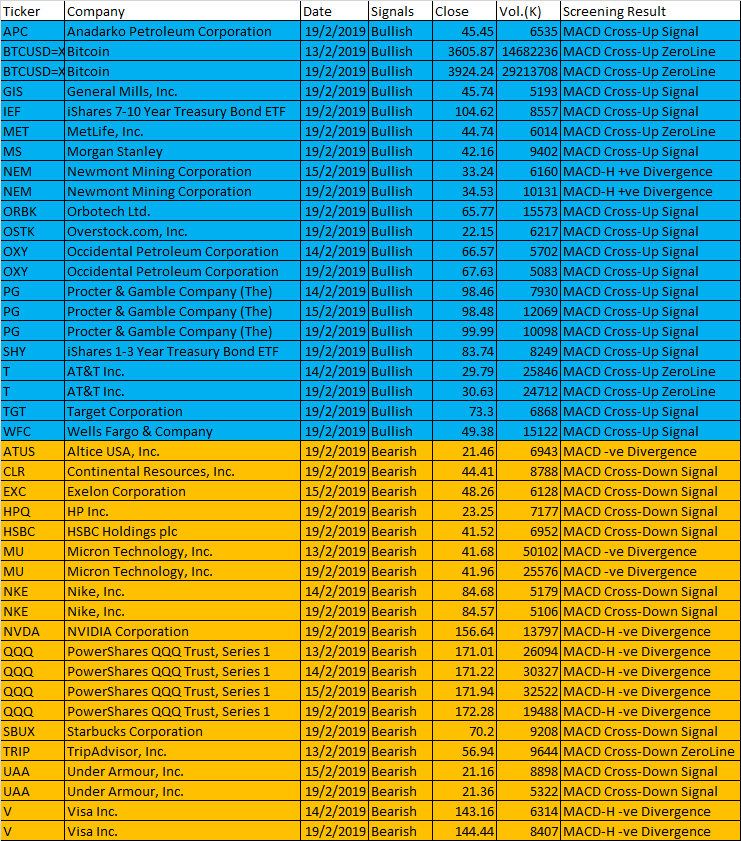
13 to 19 February 2019 AmiBroker AFL Script Generated Five-day U.S. Stock MACD Signals
The following are script generated Five-day U.S. Stock Market MACD signals using the Powerful AmiBroker’s AFL.
The MACD Setting used is (8,17,9)
| Ticker | Company | Date | Signals | Close | Vol.(K) | Screening Result |
| APC | Anadarko Petroleum Corporation | 19/2/2019 | Bullish | 45.45 | 6535 | MACD Cross-Up Signal |
| BTCUSD=X | Bitcoin | 13/2/2019 | Bullish | 3605.87 | 14682236 | MACD Cross-Up ZeroLine |
| BTCUSD=X | Bitcoin | 19/2/2019 | Bullish | 3924.24 | 29213708 | MACD Cross-Up ZeroLine |
| GIS | General Mills, Inc. | 19/2/2019 | Bullish | 45.74 | 5193 | MACD Cross-Up Signal |
| IEF | iShares 7-10 Year Treasury Bond ETF | 19/2/2019 | Bullish | 104.62 | 8557 | MACD Cross-Up Signal |
| MET | MetLife, Inc. | 19/2/2019 | Bullish | 44.74 | 6014 | MACD Cross-Up ZeroLine |
| MS | Morgan Stanley | 19/2/2019 | Bullish | 42.16 | 9402 | MACD Cross-Up Signal |
| NEM | Newmont Mining Corporation | 15/2/2019 | Bullish | 33.24 | 6160 | MACD-H +ve Divergence |
| NEM | Newmont Mining Corporation | 19/2/2019 | Bullish | 34.53 | 10131 | MACD-H +ve Divergence |
| ORBK | Orbotech Ltd. | 19/2/2019 | Bullish | 65.77 | 15573 | MACD Cross-Up Signal |
| OSTK | Overstock.com, Inc. | 19/2/2019 | Bullish | 22.15 | 6217 | MACD Cross-Up Signal |
| OXY | Occidental Petroleum Corporation | 14/2/2019 | Bullish | 66.57 | 5702 | MACD Cross-Up Signal |
| OXY | Occidental Petroleum Corporation | 19/2/2019 | Bullish | 67.63 | 5083 | MACD Cross-Up Signal |
| PG | Procter & Gamble Company (The) | 14/2/2019 | Bullish | 98.46 | 7930 | MACD Cross-Up Signal |
| PG | Procter & Gamble Company (The) | 15/2/2019 | Bullish | 98.48 | 12069 | MACD Cross-Up Signal |
| PG | Procter & Gamble Company (The) | 19/2/2019 | Bullish | 99.99 | 10098 | MACD Cross-Up Signal |
| SHY | iShares 1-3 Year Treasury Bond ETF | 19/2/2019 | Bullish | 83.74 | 8249 | MACD Cross-Up Signal |
| T | AT&T Inc. | 14/2/2019 | Bullish | 29.79 | 25846 | MACD Cross-Up ZeroLine |
| T | AT&T Inc. | 19/2/2019 | Bullish | 30.63 | 24712 | MACD Cross-Up ZeroLine |
| TGT | Target Corporation | 19/2/2019 | Bullish | 73.3 | 6868 | MACD Cross-Up Signal |
| WFC | Wells Fargo & Company | 19/2/2019 | Bullish | 49.38 | 15122 | MACD Cross-Up Signal |
| ATUS | Altice USA, Inc. | 19/2/2019 | Bearish | 21.46 | 6943 | MACD -ve Divergence |
| CLR | Continental Resources, Inc. | 19/2/2019 | Bearish | 44.41 | 8788 | MACD Cross-Down Signal |
| EXC | Exelon Corporation | 15/2/2019 | Bearish | 48.26 | 6128 | MACD Cross-Down Signal |
| HPQ | HP Inc. | 19/2/2019 | Bearish | 23.25 | 7177 | MACD Cross-Down Signal |
| HSBC | HSBC Holdings plc | 19/2/2019 | Bearish | 41.52 | 6952 | MACD Cross-Down Signal |
| MU | Micron Technology, Inc. | 13/2/2019 | Bearish | 41.68 | 50102 | MACD -ve Divergence |
| MU | Micron Technology, Inc. | 19/2/2019 | Bearish | 41.96 | 25576 | MACD -ve Divergence |
| NKE | Nike, Inc. | 14/2/2019 | Bearish | 84.68 | 5179 | MACD Cross-Down Signal |
| NKE | Nike, Inc. | 19/2/2019 | Bearish | 84.57 | 5106 | MACD Cross-Down Signal |
| NVDA | NVIDIA Corporation | 19/2/2019 | Bearish | 156.64 | 13797 | MACD-H -ve Divergence |
| QQQ | PowerShares QQQ Trust, Series 1 | 13/2/2019 | Bearish | 171.01 | 26094 | MACD-H -ve Divergence |
| QQQ | PowerShares QQQ Trust, Series 1 | 14/2/2019 | Bearish | 171.22 | 30327 | MACD-H -ve Divergence |
| QQQ | PowerShares QQQ Trust, Series 1 | 15/2/2019 | Bearish | 171.94 | 32522 | MACD-H -ve Divergence |
| QQQ | PowerShares QQQ Trust, Series 1 | 19/2/2019 | Bearish | 172.28 | 19488 | MACD-H -ve Divergence |
| SBUX | Starbucks Corporation | 19/2/2019 | Bearish | 70.2 | 9208 | MACD Cross-Down Signal |
| TRIP | TripAdvisor, Inc. | 13/2/2019 | Bearish | 56.94 | 9644 | MACD Cross-Down ZeroLine |
| UAA | Under Armour, Inc. | 15/2/2019 | Bearish | 21.16 | 8898 | MACD Cross-Down Signal |
| UAA | Under Armour, Inc. | 19/2/2019 | Bearish | 21.36 | 5322 | MACD Cross-Down Signal |
| V | Visa Inc. | 14/2/2019 | Bearish | 143.16 | 6314 | MACD-H -ve Divergence |
| V | Visa Inc. | 19/2/2019 | Bearish | 144.44 | 8407 | MACD-H -ve Divergence |
Moses U.S. Stock MACD Scan
AmiBroker Academy.com
Disclaimer
The above result is for illustration purpose. It is not meant to be used for buy or sell decision. We do not recommend any particular stocks. If particular stocks of such are mentioned, they are meant as demonstration of Amibroker as a powerful charting software and MACD. Amibroker can program to scan the stocks for buy and sell signals.
These are script generated signals. Not all scan results are shown here. The MACD signal should use with price action. Users must understand what MACD and price action are all about before using them. If necessary you should attend a course to learn more on Technical Analysis (TA) and Moving Average Convergence Divergence, MACD.
Once again, the website does not guarantee any results or investment return based on the information and instruction you have read here. It should be used as learning aids only and if you decide to trade real money, all trading decision should be your own.