7 April, 2018
The Financial Market Revamp …
Be aware, “Trend Will Change Over Night As Policy Change Over Night too”
On tariffs matter, even the strongest supporters of Trump’s move, like Commerce Secretary Wilbur Ross, appeared at least moderately unsure what’s actually going to happen. …
In the past, all understand the financial trend do not change suddenly or in simple term overnight as the country policy does not change over night, but these days we should have our mind wake up as this is what have been happened recently. Each day, you hear something. …
US Stock Chart Analysis
TM Toyota Motor Corporation and Fibonacci Extension From Low to High
Picture worth a thousand words, see chart on Toyota Motor Corporation using Fibonacci Extension. Swing low to high, the stock price resisted by 150%. The price action since make bearish ABCD move. The stock price did not get supported by the 0% level. The price action nearly supported by 23%.
Manage your risk!
Toyota Motor, a Japanese car maker.
Powerful Chart Software – AmiBroker
The following chart is produced using AmiBroker charting software. It is a powerful chart software. Anything, finance ticket you could download from Yahoo! Finance you could plot them, those you are interested all in a chart, so you could analyse them.
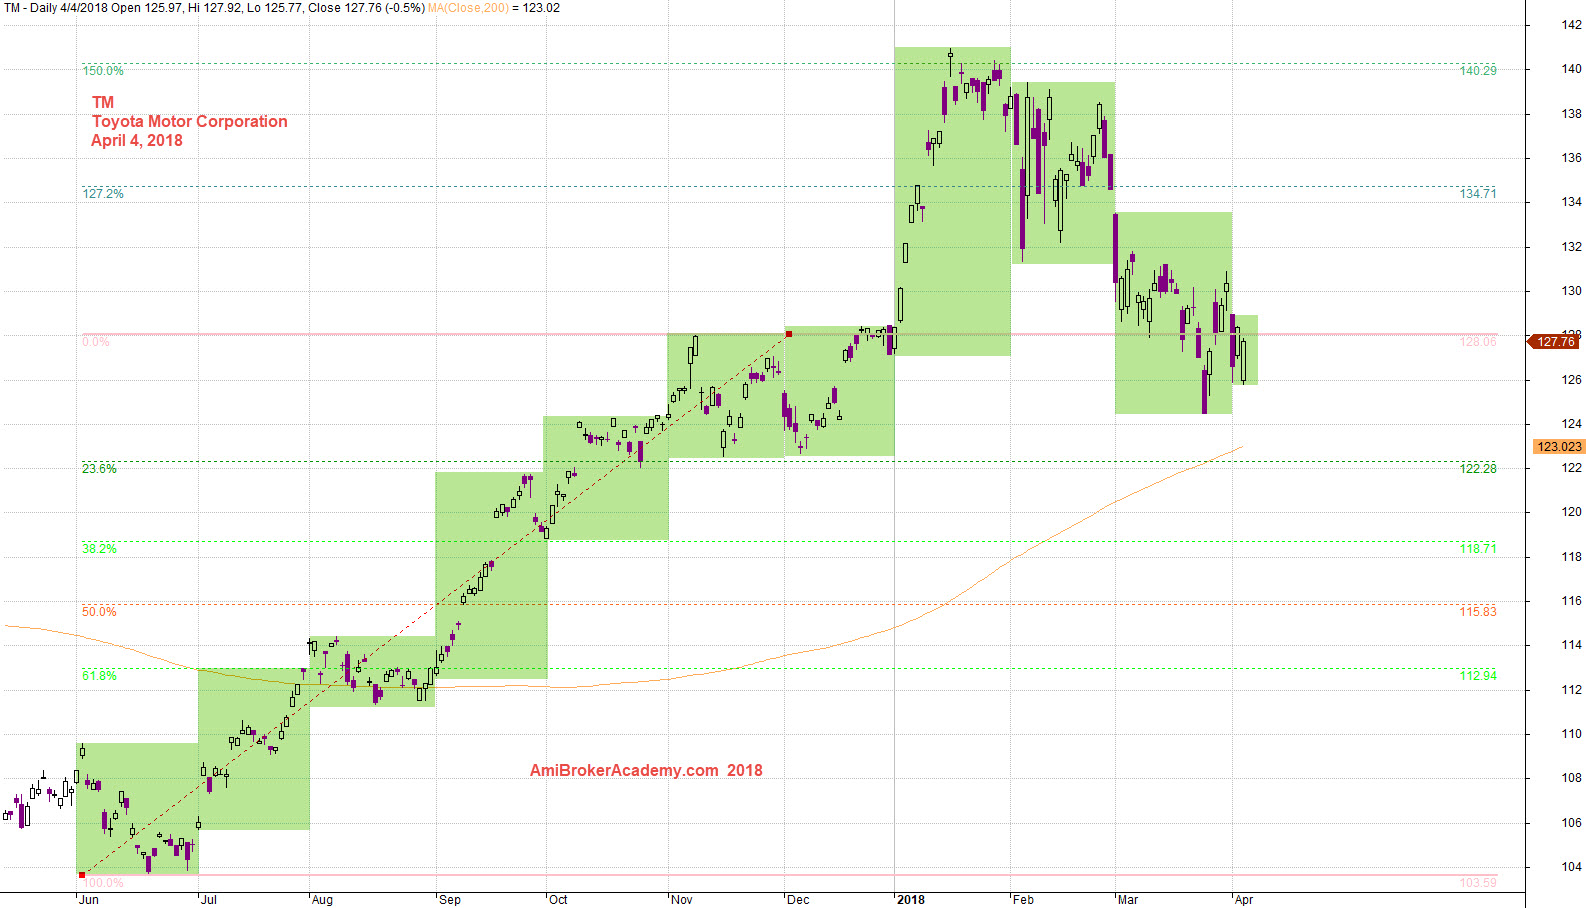
April 4, 2018 Toyota Motor Corporation and Fibo Extension Low to High
Moses US Stock Chart Analysis
AmiBrokerAcademy.com
Disclaimer
The above result is for illustration purpose. It is not meant to be used for buy or sell decision. We do not recommend any particular stocks. If particular stocks of such are mentioned, they are meant as demonstration of Amibroker as a powerful charting software and MACD. Amibroker can program to scan the stocks for buy and sell signals.
These are script generated signals. Not all scan results are shown here. The MACD signal should use with price action. Users must understand what MACD and price action are all about before using them. If necessary you should attend a course to learn more on Technical Analysis (TA) and Moving Average Convergence Divergence, MACD.
Once again, the website does not guarantee any results or investment return based on the information and instruction you have read here. It should be used as learning aids only and if you decide to trade real money, all trading decision should be your own.