January 29, 2020
Welcome!
Welcome to AmiBrokerAcademy.com. Thanks for visiting the site.
Zoom in, zoom in. Let study the NASDAQ Index more closely and understand the trend in 2020.
^IXIC NASDAQ Compostie Index Charting
Study NASDAQ Composite Index 纳斯达克综合指数 stock chart price action and year high low.
See chart, picture worth a thousand words.
Manage your expectation.
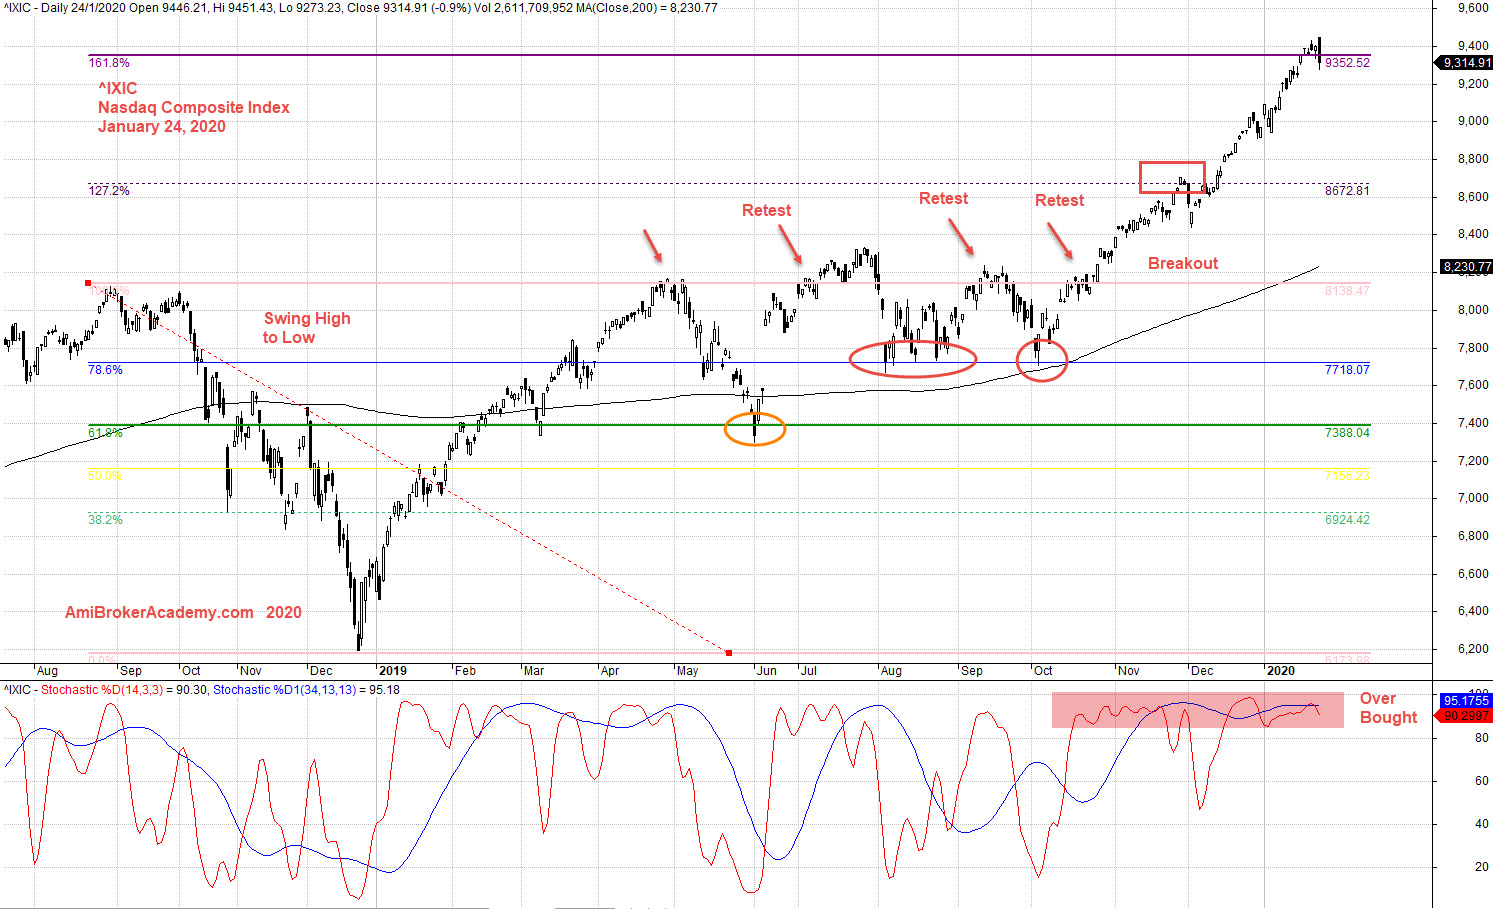
Draw a Fibonacci Extension to project the price action rebounce. Swing high to low, from near 8,200 to 6,200. We see the price action retrace up to test 8200 points level. Prince action keep retest the 8200 level. Finally breakout higher.
Price action stop at 127% level, and breakout again. Price Action now testing 161% level.
Is NASDAQ Composite Index near topping? Will see. Manage your risk and trade with your eyes open.
Trade what you see and not what you think.
Add Stochastic Indicator, and see at overbought for the last four months.
Moses Stock Observation
AmiBrokerAcademy.com
Disclaimer
The above result is for illustration purpose. It is not meant to be used for buy or sell decision. We do not recommend any particular stocks. If particular stocks of such are mentioned, they are meant as demonstration of Amibroker as a powerful charting software and MACD. Amibroker can program to scan the stocks for buy and sell signals.
These are script generated signals. Not all scan results are shown here. The MACD signal should use with price action. Users must understand what MACD and price action are all about before using them. If necessary you should attend a course to learn more on Technical Analysis (TA) and Moving Average Convergence Divergence, MACD.
Once again, the website does not guarantee any results or investment return based on the information and instruction you have read here. It should be used as learning aids only and if you decide to trade real money, all trading decision should be your own.