June 13, 2019
Welcome!
Welcome to AmiBrokerAcademy.com. Thanks for visiting the site.
Have fun!
^DJI Dow Jones Industrial Average Index 道琼斯工业指数 Stock Charting
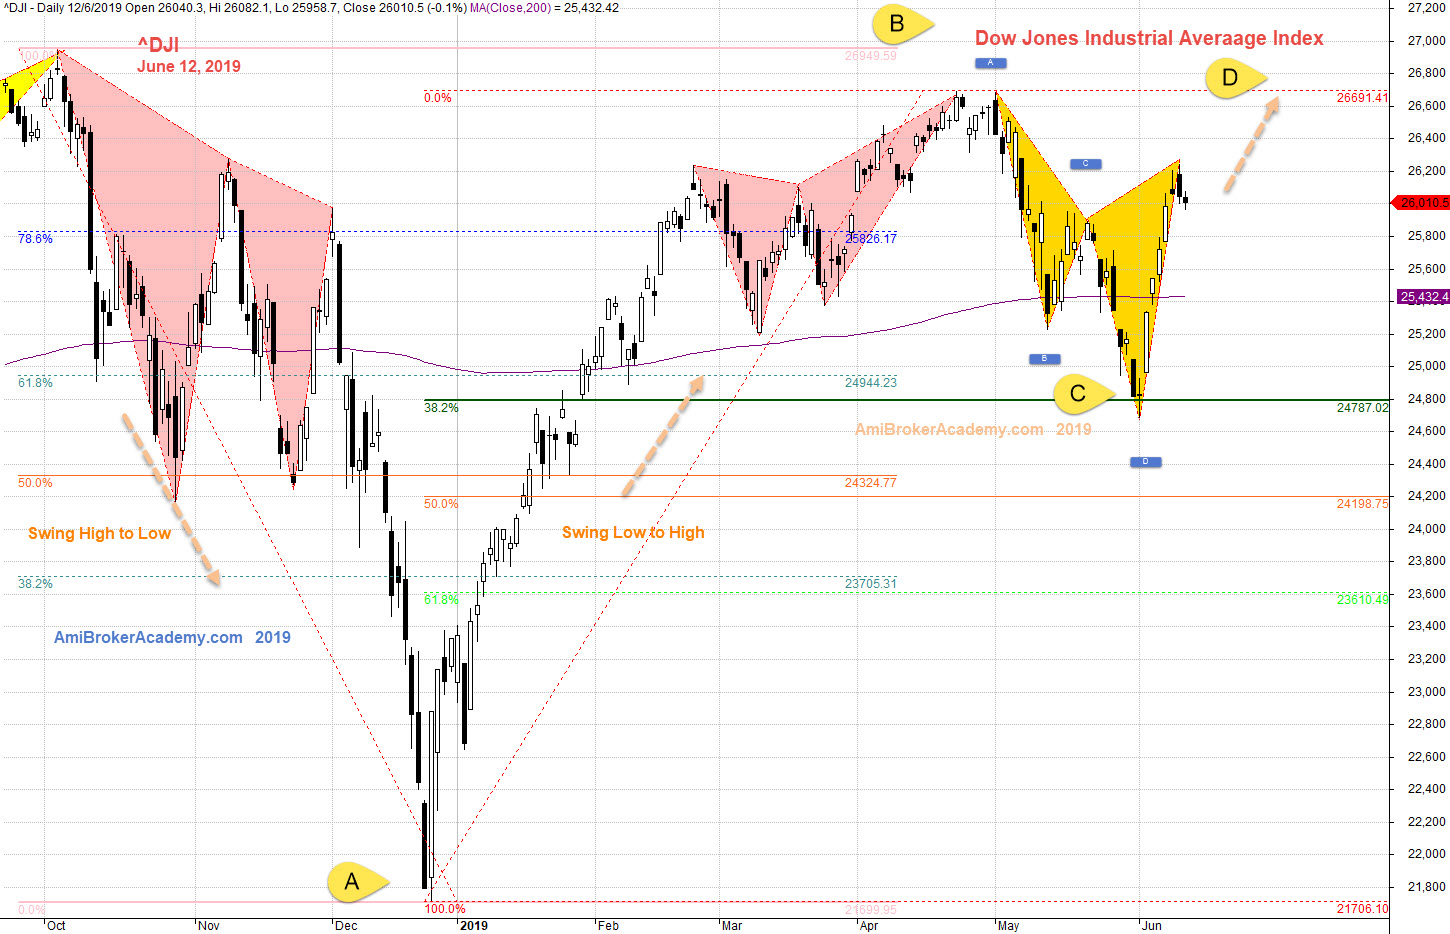
Let’s study Dow Jones Industrial Average Index 道琼斯工业指数 stock chart using Fibonacci.
See chart, picture worth a thousand words.
We add a Fibonacci Retracement from swing high to low to find resistance, the retracement almost retest the 100%, same high.
Next we add another Fibonacci retracement swing low to high to find the support. Price action pullback and get supported by 38%.
Can you spot H M Gartley patterns? You could see a completed abcd pattern down. You may see a work in progress ABCD, Now in CD leg.
Trade with your eyes open.
Moses Stock Observation
AmiBrokerAcademy.com
Disclaimer
The above result is for illustration purpose. It is not meant to be used for buy or sell decision. We do not recommend any particular stocks. If particular stocks of such are mentioned, they are meant as demonstration of Amibroker as a powerful charting software and MACD. Amibroker can program to scan the stocks for buy and sell signals.
These are script generated signals. Not all scan results are shown here. The MACD signal should use with price action. Users must understand what MACD and price action are all about before using them. If necessary you should attend a course to learn more on Technical Analysis (TA) and Moving Average Convergence Divergence, MACD.
Once again, the website does not guarantee any results or investment return based on the information and instruction you have read here. It should be used as learning aids only and if you decide to trade real money, all trading decision should be your own.