16 November, 2019
Welcome to AmiBrokerAcademy.com. Thanks for visiting the site.
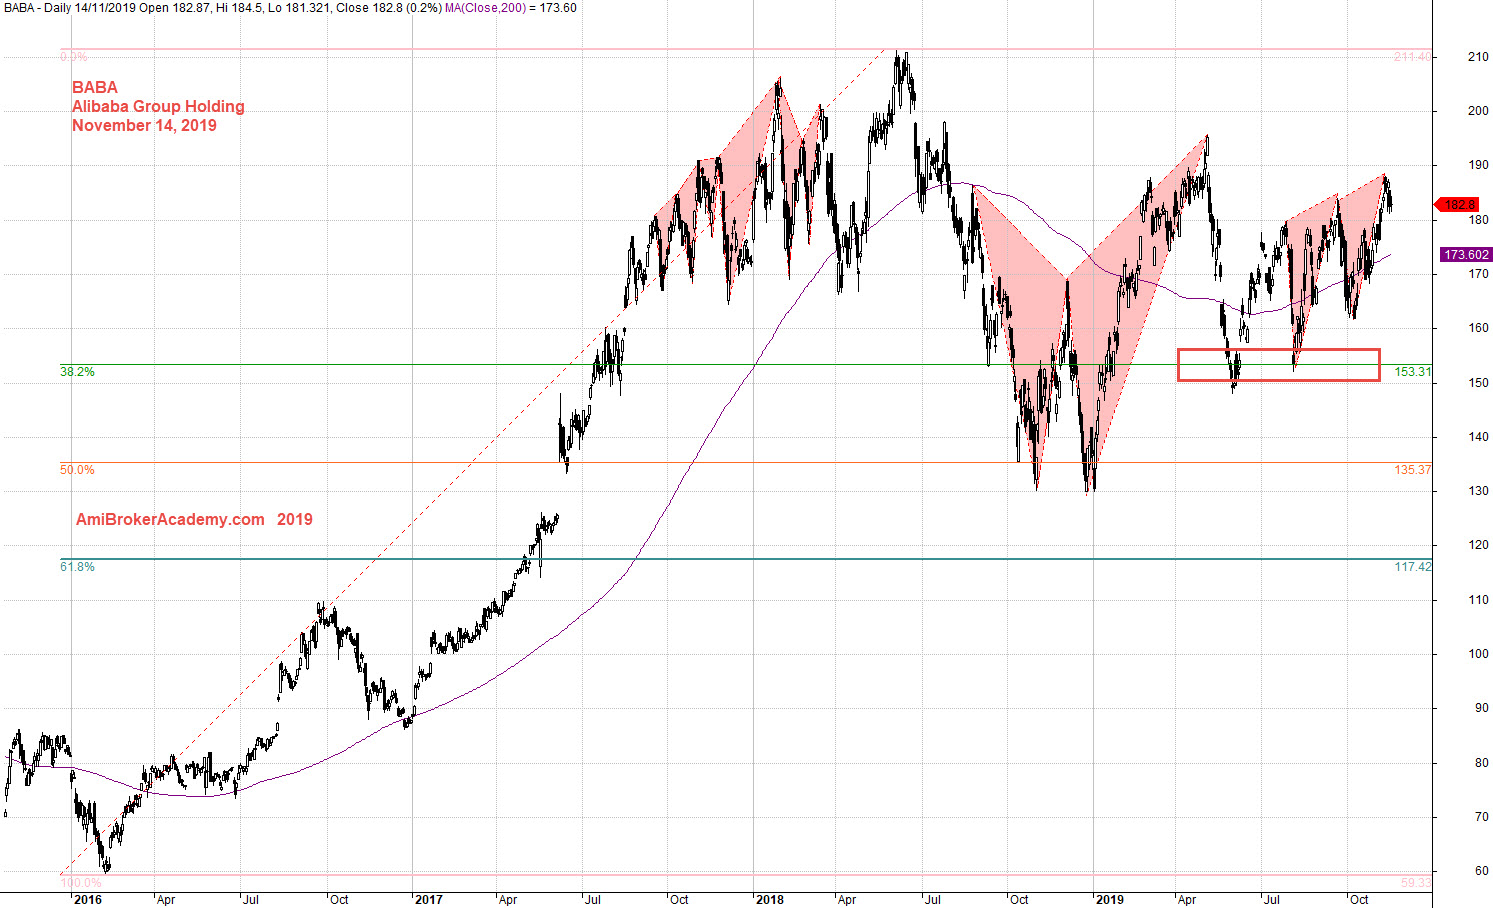
BABA Alibaba Group Holding Stock Stock Charting
Study Alibaba Group Holdingstock chart and Fibonacci and Support Level.
Look left and think right. Manage your expectation.
See chart, picture worth a thousand words.
Price Action swing low to high and pullback. Price Action after test tge 50%, and again test the 38%.
Trade with eyes open.
Can Alibaba Hong Kong IPO divert the Alibaba US demand? Will see.
Alibaba Hong Kong IPO
Alibaba will offer 500 million shares in Hong Kong and priced at up to HK$188 (or 24 USD) each for retail investors. Shares are due to start trading on 26 November 2019.
Moses Stock Observation
AmiBrokerAcademy.com
Disclaimer
The above result is for illustration purpose. It is not meant to be used for buy or sell decision. We do not recommend any particular stocks. If particular stocks of such are mentioned, they are meant as demonstration of Amibroker as a powerful charting software and MACD. Amibroker can program to scan the stocks for buy and sell signals.
These are script generated signals. Not all scan results are shown here. The MACD signal should use with price action. Users must understand what MACD and price action are all about before using them. If necessary you should attend a course to learn more on Technical Analysis (TA) and Moving Average Convergence Divergence, MACD.
Once again, the website does not guarantee any results or investment return based on the information and instruction you have read here. It should be used as learning aids only and if you decide to trade real money, all trading decision should be your own.