May 30, 2019
Welcome!
Welcome to AmiBrokerAcademy.com. Thanks for visiting the site.
Have fun!
BTO John Hancock Financial Opportunities Fund Stock Charting
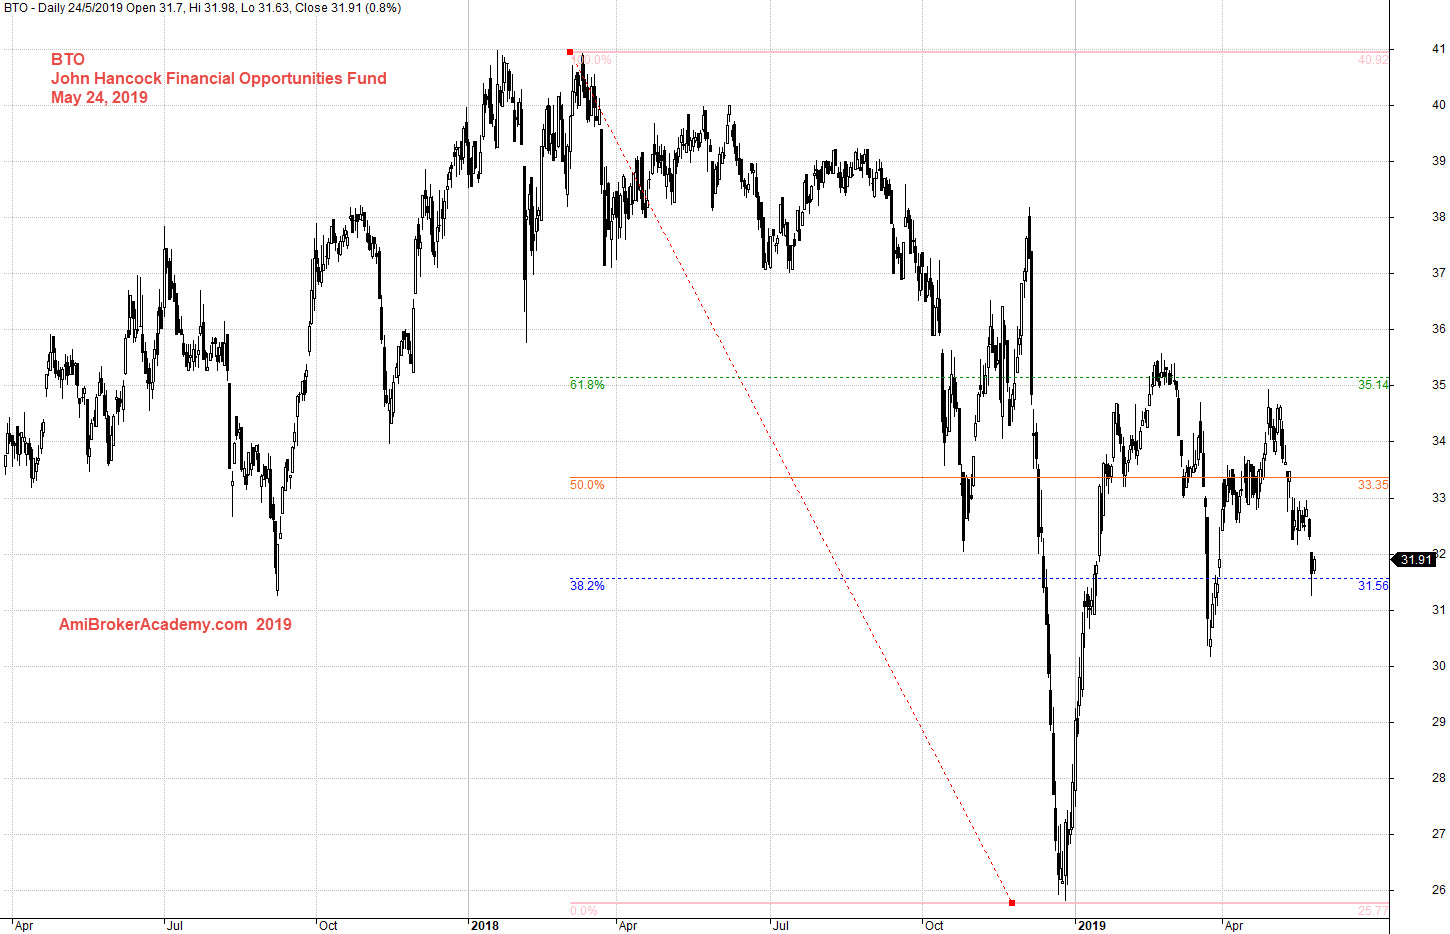
Study John Hancock Financial Opportunities Fund stock chart and Fibonacci Retracement.
See chart, picture worth a thousand words.
Swing high to low to find the possible resistance from Fibonacci Retracement.
BTO after test the high at 41 dollars and begin to decline. See chart, stock price finally touch the bottom at 26 dollars.
Price action pullback after the bottom, price action hit the resistance at 61%. Will price action be resisted by 61%? Will see.
Trade with eyes open.
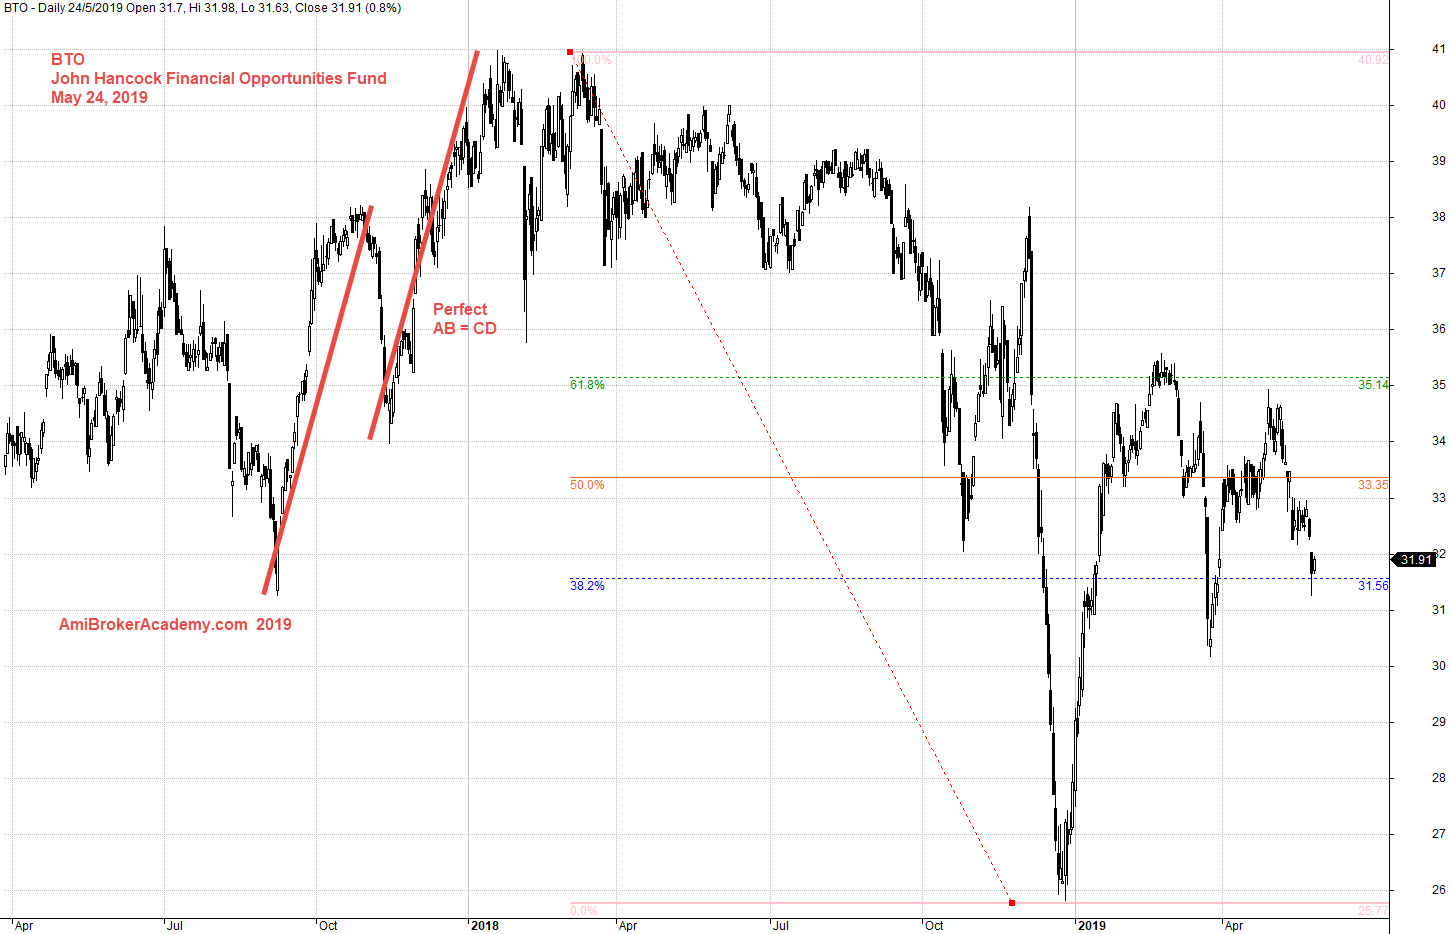
Look back on the price action before the price action hit the top, you see H M Gartley AB = CD pattern. See chart below.
Moses Stock Observation
AmiBrokerAcademy.com
Disclaimer
The above result is for illustration purpose. It is not meant to be used for buy or sell decision. We do not recommend any particular stocks. If particular stocks of such are mentioned, they are meant as demonstration of Amibroker as a powerful charting software and MACD. Amibroker can program to scan the stocks for buy and sell signals.
These are script generated signals. Not all scan results are shown here. The MACD signal should use with price action. Users must understand what MACD and price action are all about before using them. If necessary you should attend a course to learn more on Technical Analysis (TA) and Moving Average Convergence Divergence, MACD.
Once again, the website does not guarantee any results or investment return based on the information and instruction you have read here. It should be used as learning aids only and if you decide to trade real money, all trading decision should be your own.