April 5 2020
Welcome to AmiBrokerAcademy.com. Thanks for visiting the site.
Hold no position and worry free.
Stock Chart At A Glance
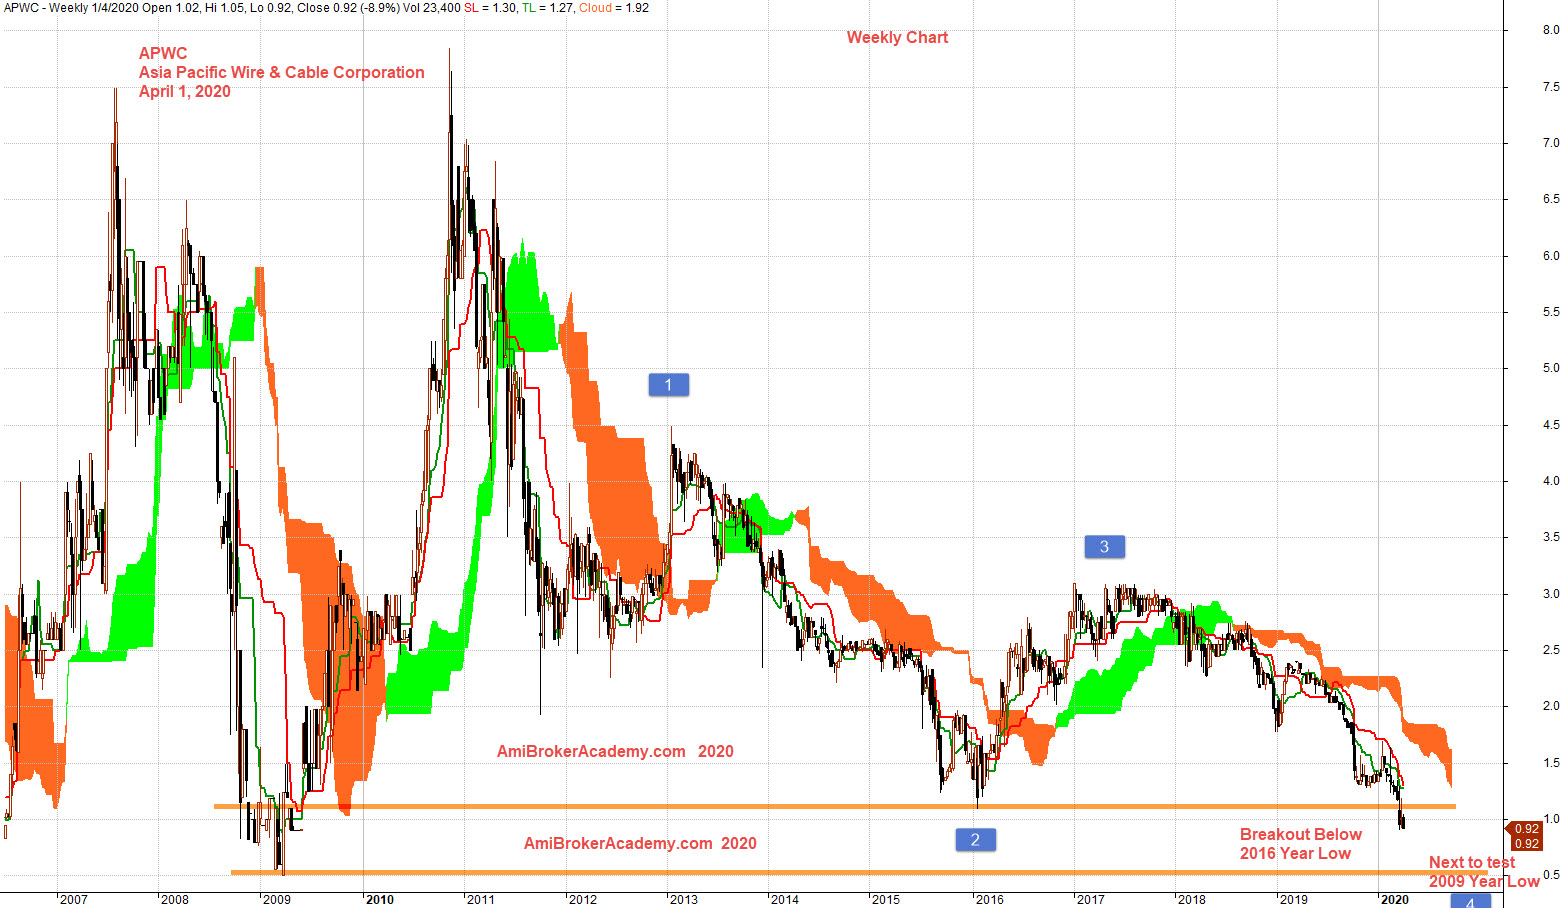
APWC Asia Pacific Wire and Cable Corporation Stock Charting
Study Asia Pacific Wire and Cable Corporation Weekly stock chart price action and Ichimoku Cloud.
Look left and think right. Manage your expectation.
See chart, picture worth a thousand words.
Study support resistance.
Price Action formed double top before 2010. Thereafter the price action begin to drift south.
Now, price action has breakout below 2016 year low.
Think Think Got More Things
Catch the bottom? Don’t try.
You might be right! To catch the bottom. We wish you good luck.
Fall may not be final! No one is wise to know.
Moses Stock Observation
AmiBrokerAcademy.com
Disclaimer
The above result is for illustration purpose. It is not meant to be used for buy or sell decision. We do not recommend any particular stocks. If particular stocks of such are mentioned, they are meant as demonstration of Amibroker as a powerful charting software and MACD. Amibroker can program to scan the stocks for buy and sell signals.
These are script generated signals. Not all scan results are shown here. The MACD signal should use with price action. Users must understand what MACD and price action are all about before using them. If necessary you should attend a course to learn more on Technical Analysis (TA) and Moving Average Convergence Divergence, MACD.
Once again, the website does not guarantee any results or investment return based on the information and instruction you have read here. It should be used as learning aids only and if you decide to trade real money, all trading decision should be your own.