October 4, 2017
Today is Mid-Autumn Festival for 2017.
F03 Food Empire Holdings and Support Resistance
Picture worth a thousand words, see chart on breakout and retest. Food Empire breakout from 64 cents and retest 64 cents again. But, after the second retest the price breakout below on the third time. The price drop down to 58 cents.
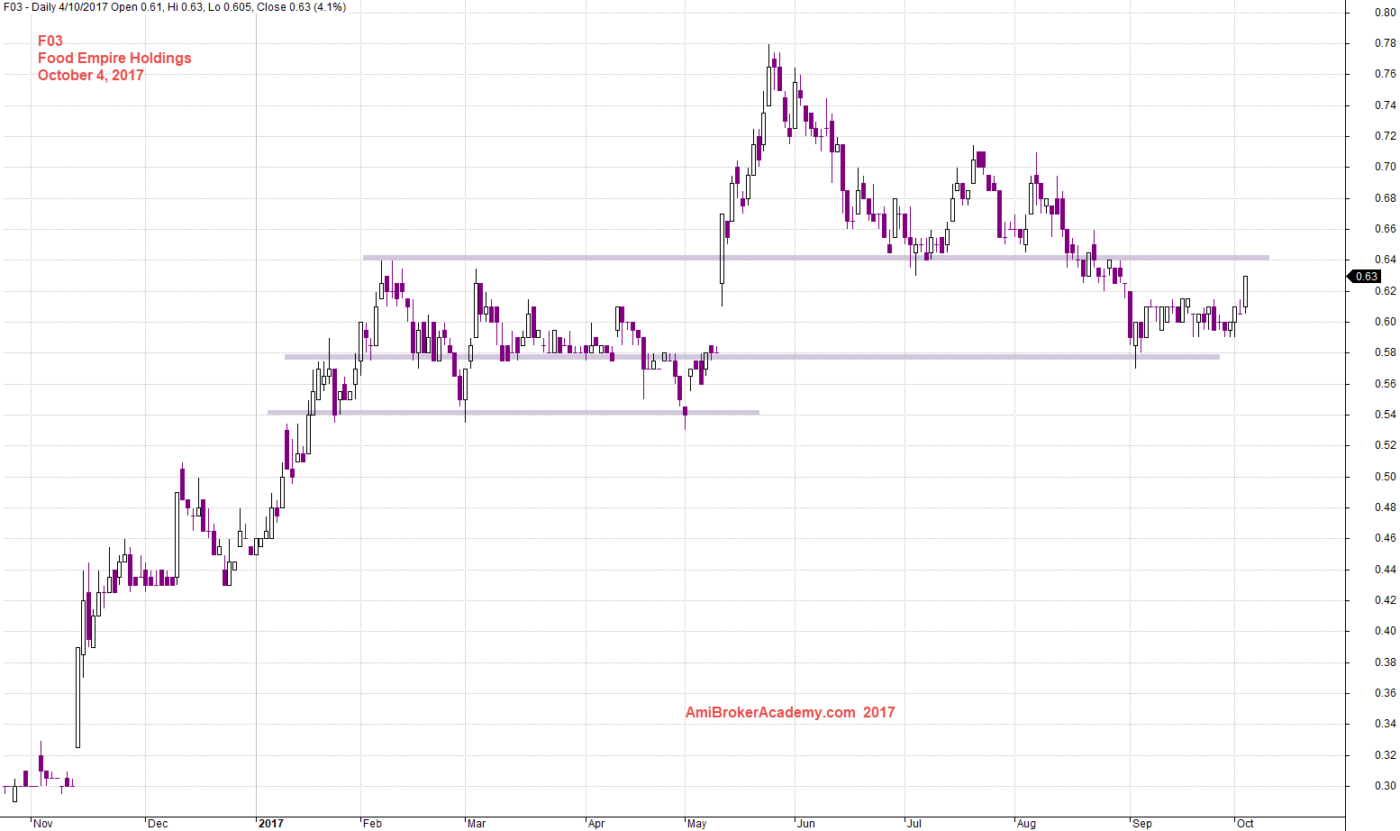
October 4, 2017 Food Empire Holdings and Support Resistance
F03 Food Empire Holdings and ABCD Chart Pattern
Picture worth a thousand words, see chart on ABCD chart pattern. Now ABCD buy? Remember all setup can fail. Watch your risk.
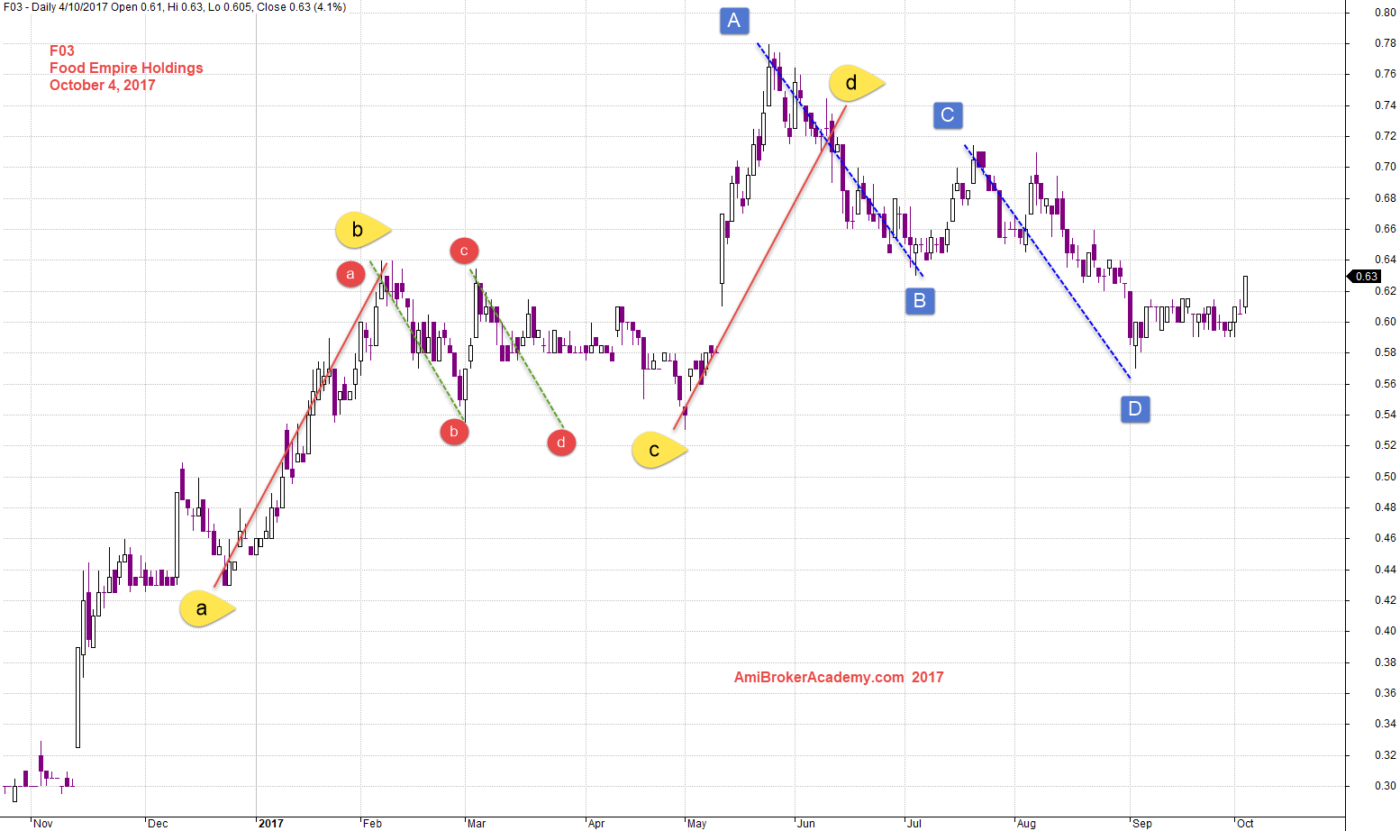
October 4, 2017 Food Empire Holdings and ABCD Chart Pattern
Moses
AmiBrokerAcademy.com
Disclaimer
The above result is for illustration purpose. It is not meant to be used for buy or sell decision. We do not recommend any particular stocks. If particular stocks of such are mentioned, they are meant as demonstration of Amibroker as a powerful charting software and MACD. Amibroker can program to scan the stocks for buy and sell signals.
These are script generated signals. Not all scan results are shown here. The MACD signal should use with price action. Users must understand what MACD and price action are all about before using them. If necessary you should attend a course to learn more on Technical Analysis (TA) and Moving Average Convergence Divergence, MACD.
Once again, the website does not guarantee any results or investment return based on the information and instruction you have read here. It should be used as learning aids only and if you decide to trade real money, all trading decision should be your own.