March 19, 2018
US Stock Chart Analysis
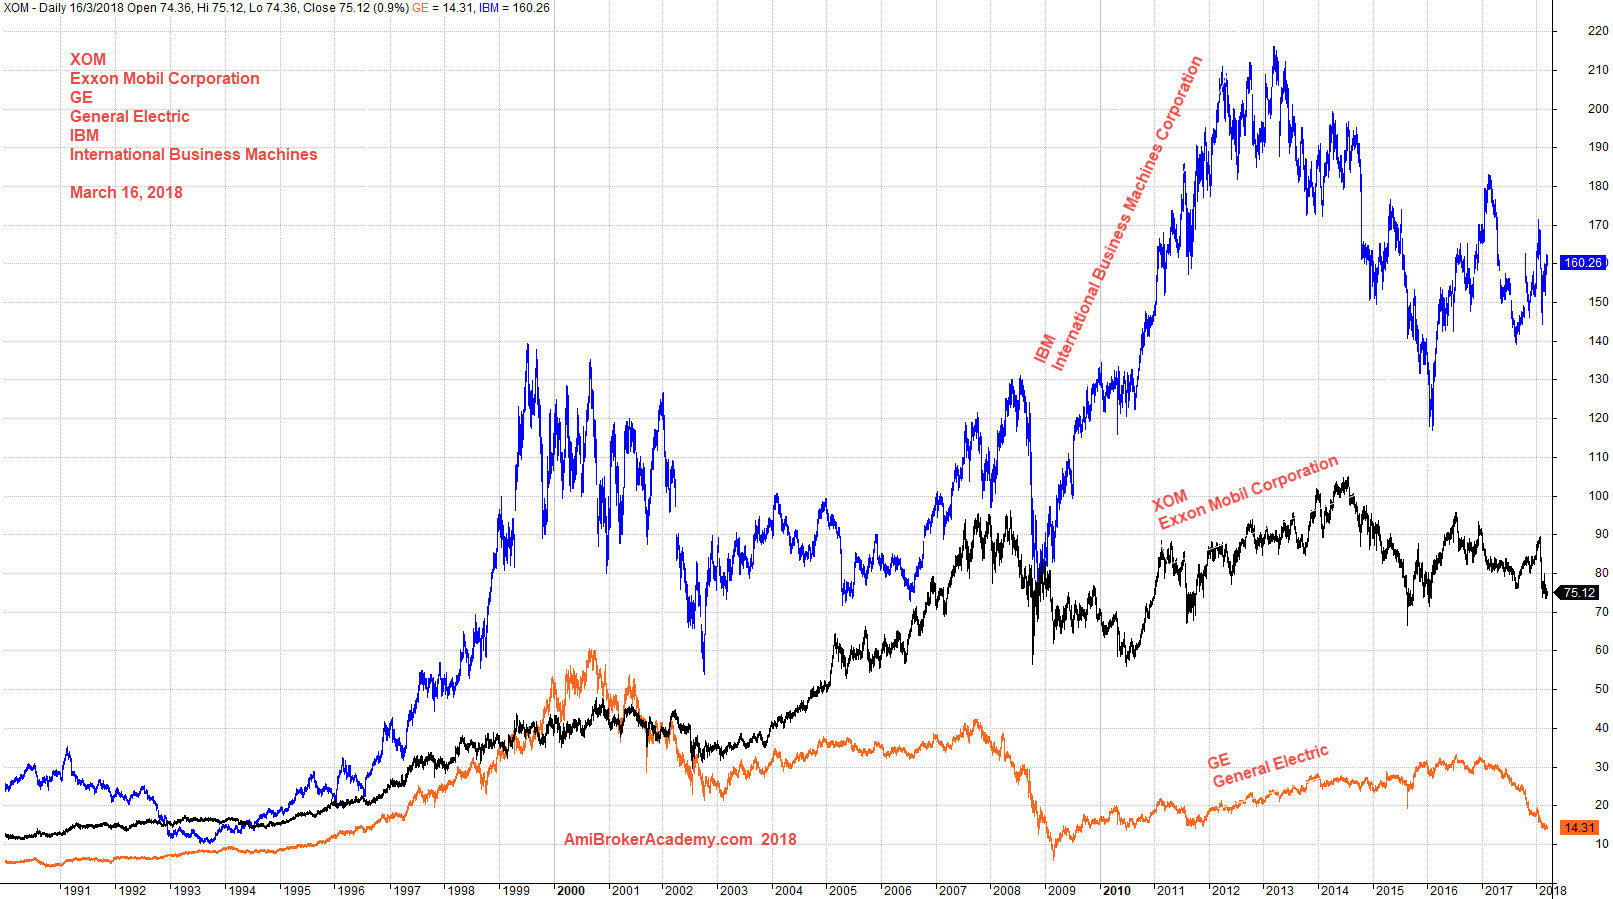
Exxon Mobil, General Electric and IBM Charting
If your have fifty dollars back in 1991, and you are given a choice to buy one share from the following, Exxon Mobil, General Electric or IBM. And assume you keep the share till today, which one will give you a value for money investment.
Study chart on the price action, IBM will give your the better value, and General Electric will be the worst. However, these are all on the surface. The reason is simple, these are not taken into the account of such thing like dividend yield and so on.
Now, remember in trading there is not right or wrong, it is all relative. Trade with your eyes open. I was watching the TV talk show on Saturday, there were five celebrities sharing their live story. One of them was talking about being “con” by an investment guru back in the 2000, she was followed the guru on the future and so on. The guru was making million after million of profit, and for her she was losing over and over for hundred of thousands. I believe you probably share the same feeling, the advice you got has always wrong from the “expert”. Now if you look back and study the chart again, you should find the reason of failure.
The key is “timing”. Yes, timing. When you get to know the buy or sell instruction, by the time you enter the trade. The expert might be ready to take profit the leave, as the stock might be already over bought. So, you enter the trade and do not get out in time. You lost your pant.
This celebrity got a margin call when she was taking her vacation. By the third margin call, she has already exhausted all her saving. So, her point was not to believe in any guru. I told agree with here, does not matter your teacher, guru, or master is so experience and good. You still have to do your own home work. Manage your own risk, trade within your mean.
Now compare these three stock with the stars today, like Amazon.com or Google. The stock price are nothing. So, be yourself and do not compare.
Manage your risk!
Powerful Chart Software – AmiBroker
The following chart is produced using AmiBroker charting software. It is a powerful chart software. Anything, finance ticket you could download from Yahoo! Finance you could plot them, those you are interested all in a chart, so you could analyse them.
March 16, 2018 Exxon Mobil, General Electric and IBM Bench Marking
Moses US Stock Chart Analysis
AmiBrokerAcademy.com
Disclaimer
The above result is for illustration purpose. It is not meant to be used for buy or sell decision. We do not recommend any particular stocks. If particular stocks of such are mentioned, they are meant as demonstration of Amibroker as a powerful charting software and MACD. Amibroker can program to scan the stocks for buy and sell signals.
These are script generated signals. Not all scan results are shown here. The MACD signal should use with price action. Users must understand what MACD and price action are all about before using them. If necessary you should attend a course to learn more on Technical Analysis (TA) and Moving Average Convergence Divergence, MACD.
Once again, the website does not guarantee any results or investment return based on the information and instruction you have read here. It should be used as learning aids only and if you decide to trade real money, all trading decision should be your own.