24 October 2022
Welcome!
Welcome to AmiBroker Academy dot com, amibrokeracademy.com.
If There is Only One Chart. This is It!
The Moses Power Stock Chart.
Picture worth a thousand words. Trade what you see!
We Only Believe – Buy Support or Sell Resistance.
We did an analysis on Ethereum two days back.
Sony and Honda
Sony, Honda aim to deliver premium EV with subscription fees in 2026, an article from Reuters, see link. Reported by Satoshi Sugiyama and Maki Shiraki.
Electronic Vehicle seems to be the catch for most of the company. Even Foxconn a Taiwanese multinational electronics contract manufacturer also embark on the race. Foxconn has pushed into EV hope to be beyond iPhone. Read more on Foxconn Unveils Pickup, Crossover Models to Expand EV Lineup from Bloomberg by Samson Ellis and Debby Wu.
Too much distraction and there are too much uncertainty in the current market, with the war and super power struggle for more power and war. Also, with new financial instrument, such as cryptocurrency, but the stocks, gold and crude oil continue to be on the spotlight.
We study the stock chart using GMMA, Woodies CCI, MACD, River, Ichimoku Cloud, Bollinger Bands and Moving Average, and wave patterns with the price action.
Moving Average is a great visual tool. MACD indicator is a easy to understand indicator. Support and Resistance is important and fundamental tool for buy sell.
When the price action continue to move higher but MACD is weaker, the price action may be change in direction. The opposite is true too, when price action is weaker, forming lower low but the MACD or MACD Histogram is forming higher low. Price action is also may be change in direction.
But remember indicator is like traffic light, it only provides you a heads-up for the possible upcoming change.
Manage your trade.
Just One Chart
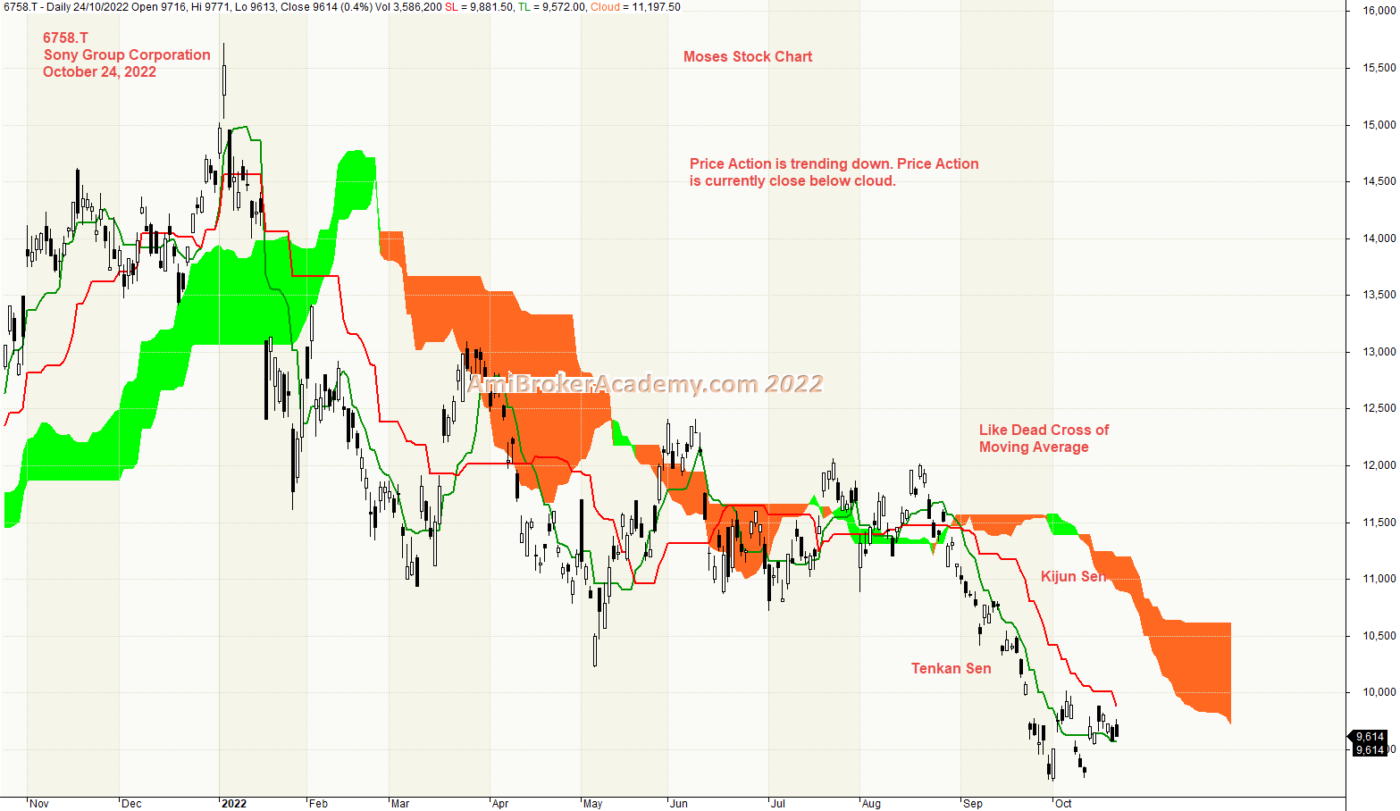
1) Sony Group Corporation and Ichimoku Cloud
Sony stock price has been decline in 2022. the price action is testing the floor.
Remember to only buy support and sell resistance. Manage your risk.
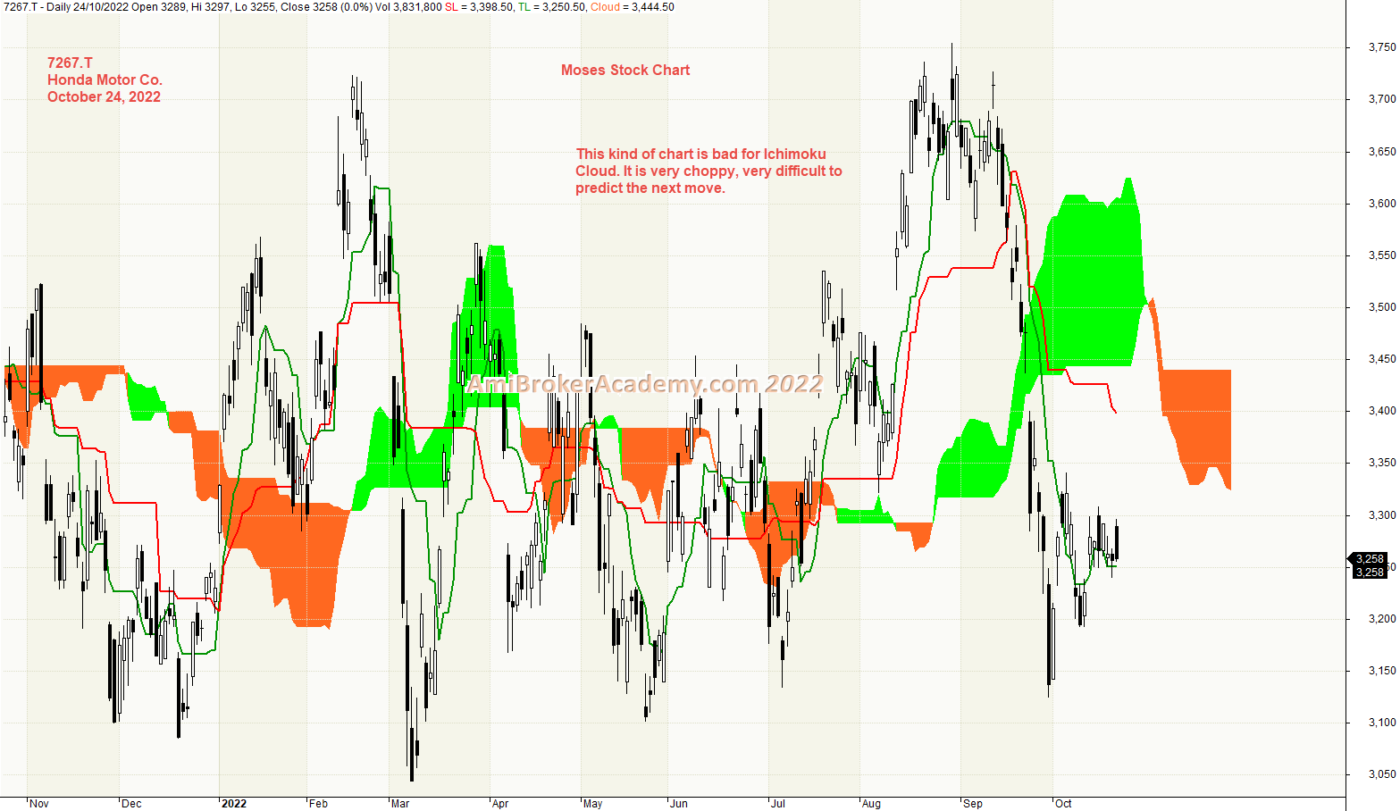
2) Honda Motor Co and Ichimoku Cloud
Ichimoku Cloud is difficult to apply in the following chart, as the indicator is greater for trending chart. Manage your risk.
Moses Power Charting
Official AmiBrokerAcademy.com Charting
Disclaimer
The above result is for illustration purpose. It is meant to be used for learning buy or sell signals. We do not recommend for any particular stocks. If particular stocks of such are mentioned, they are meant as a demonstration of Amibroker as a powerful charting software. Amibroker is a charting software, it can program to scan the stocks for buy and sell signals. Or backtest for any trading strategy or technique.
We post script generated signals. Not all scan results are shown here depending on selection criterial. The MACD signal should use with price action. Users must understand what MACD and price action are all about before using them. If necessary you should attend a course to learn more on Technical Analysis (TA) and Moving Average Convergence Divergence, MACD.
Once again, the website does not guarantee any results or investment return based on the information and instruction you have read here. It should be used as learning aids only and if you decide to trade real money, all trading decision should be your own.
We learn from many past and present great traders. Kudo to these master.