20 September 2022
Welcome!
Welcome to AmiBroker Academy dot com, amibrokeracademy.com.
If There is Only One Chart. This is It!
The Moses Power Stock Chart.
Picture worth a thousand words. Trade what you see!
We Only Believe – Buy Support or Sell Resistance.
Ethereum Cryptocurrency
Just One Chart
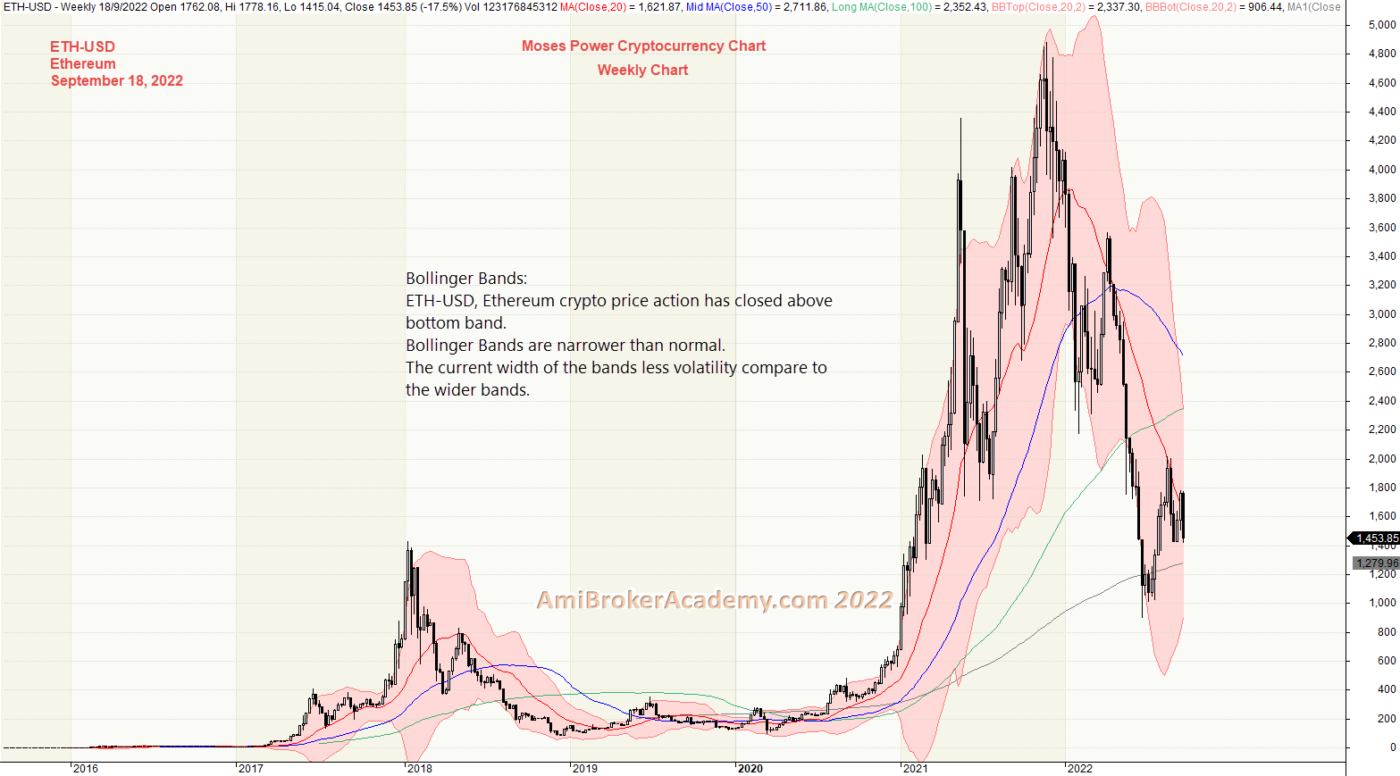
1) Ethereum Crypto Price Action and Bollinger Bands and Moving Averages
Study Ethereum using Bollinger Bands. Price Action has enclosed within the bands. Wider bands means the market is volatile, and narrow bands signify less volatile.
Below 5000 USD was the peak in 2021, and it is the higher so far for Ethereum Crypto Coin. 2018 was it higher before the current peak, the price was 1,400 USD.
Now Ethereum has pullback to test the last peak at 1,400 USD. See chart, the price has gone below 1400 USD first before return to 1400 USD level.
Can you hold? Your heart are strong enough to hold to wait for the retest of the last high, near 5000 USD.
Do you think the Ethereum price will return to 5,000 USD and higher?
Manage your risk.
Remember to buy support and sell resistance.
Moses Power Charting
Official AmiBrokerAcademy.com Charting
Disclaimer
The above result is for illustration purpose. It is meant to be used for learning buy or sell signals. We do not recommend for any particular stocks. If particular stocks of such are mentioned, they are meant as a demonstration of Amibroker as a powerful charting software. Amibroker is a charting software, it can program to scan the stocks for buy and sell signals. Or backtest for any trading strategy or technique.
We post script generated signals. Not all scan results are shown here depending on selection criterial. The MACD signal should use with price action. Users must understand what MACD and price action are all about before using them. If necessary you should attend a course to learn more on Technical Analysis (TA) and Moving Average Convergence Divergence, MACD.
Once again, the website does not guarantee any results or investment return based on the information and instruction you have read here. It should be used as learning aids only and if you decide to trade real money, all trading decision should be your own.
We learn from many past and present great traders. Kudo to these master.