June 15 2022
Welcome!
Welcome to AmiBroker Academy dot com, amibrokeracademy.com.
This was the analysis we did back in 2015. Have fun!
If There is Only One Chart This is It
Moses Power Stock Chart.
We Believe – Buy Support or Sell Resistance.
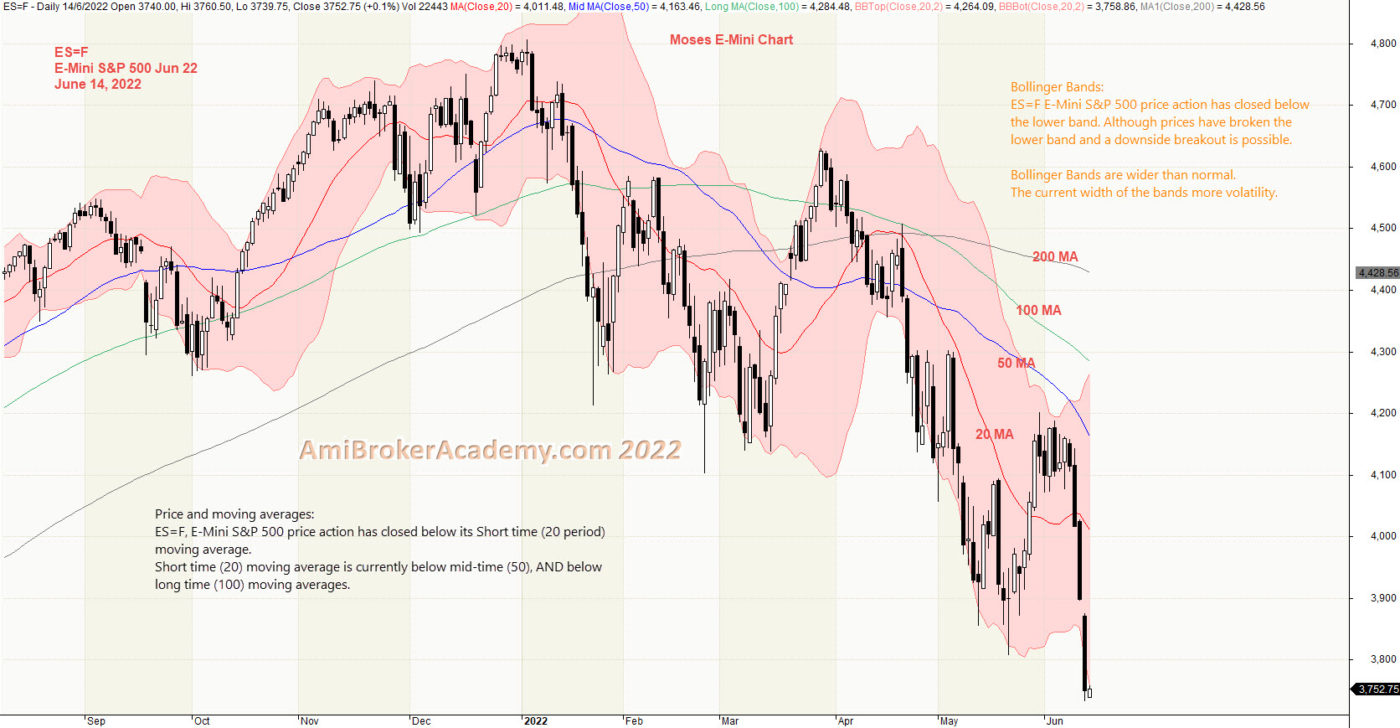
1) E-Mini S&P 500 and Bollinger Bands and Moving Averages
Price Action reflect the market emotions, it factor in news, buy or sell emotions.
Moving Average is a great visual aid. When the MA slops down, and price action close below the MA, the trend is likely bearish. The reverse is bullish. Bollinger bands is a great visual tool too, the price action encloses within the bands, when the band widen the price action is volatile, when the band narrow the price action is less volatile.
If you are a buy and hold strategist, Will you sell now or buy now? Remember only buy near support, and sell near resistance. Wait for the price action draw near either resistance or support before action.
Think Think got more Things
In trading, some predict the up or down on the trend. Here, we look for support, strong support to buy. Or take profit when price action test the resistance.
Moses Power Charting
Official AmiBrokerAcademy.com Charting
Disclaimer
The above result is for illustration purpose. It is meant to be used for learning buy or sell signals. We do not recommend for any particular stocks. If particular stocks of such are mentioned, they are meant as a demonstration of Amibroker as a powerful charting software. Amibroker is a charting software, it can program to scan the stocks for buy and sell signals. Or backtest for any trading strategy or technique.
We post script generated signals. Not all scan results are shown here depending on selection criterial. The MACD signal should use with price action. Users must understand what MACD and price action are all about before using them. If necessary you should attend a course to learn more on Technical Analysis (TA) and Moving Average Convergence Divergence, MACD.
Once again, the website does not guarantee any results or investment return based on the information and instruction you have read here. It should be used as learning aids only and if you decide to trade real money, all trading decision should be your own.
We learn from many past and present great traders. Kudo to these master.