5 December 2018
Thanks for visiting the site.
Shanghai Stock Analysis
601788.SS Shanghai Stock 光大证券 Everbright Securities Company Stock Charting
Trade with your eyes open. Manage your trade.
Support Resistance is the an important tool in technical analysis. Besides MACD indicator.
The price action after at the peak near 16.5 RMB, the price action retest 16.5 RMD but fall short, onley 16 RMB just before to move south. Price action follows a five waves count close to Elliot Wave count and test 8 RMB.
See chart, trade with your eyes open.
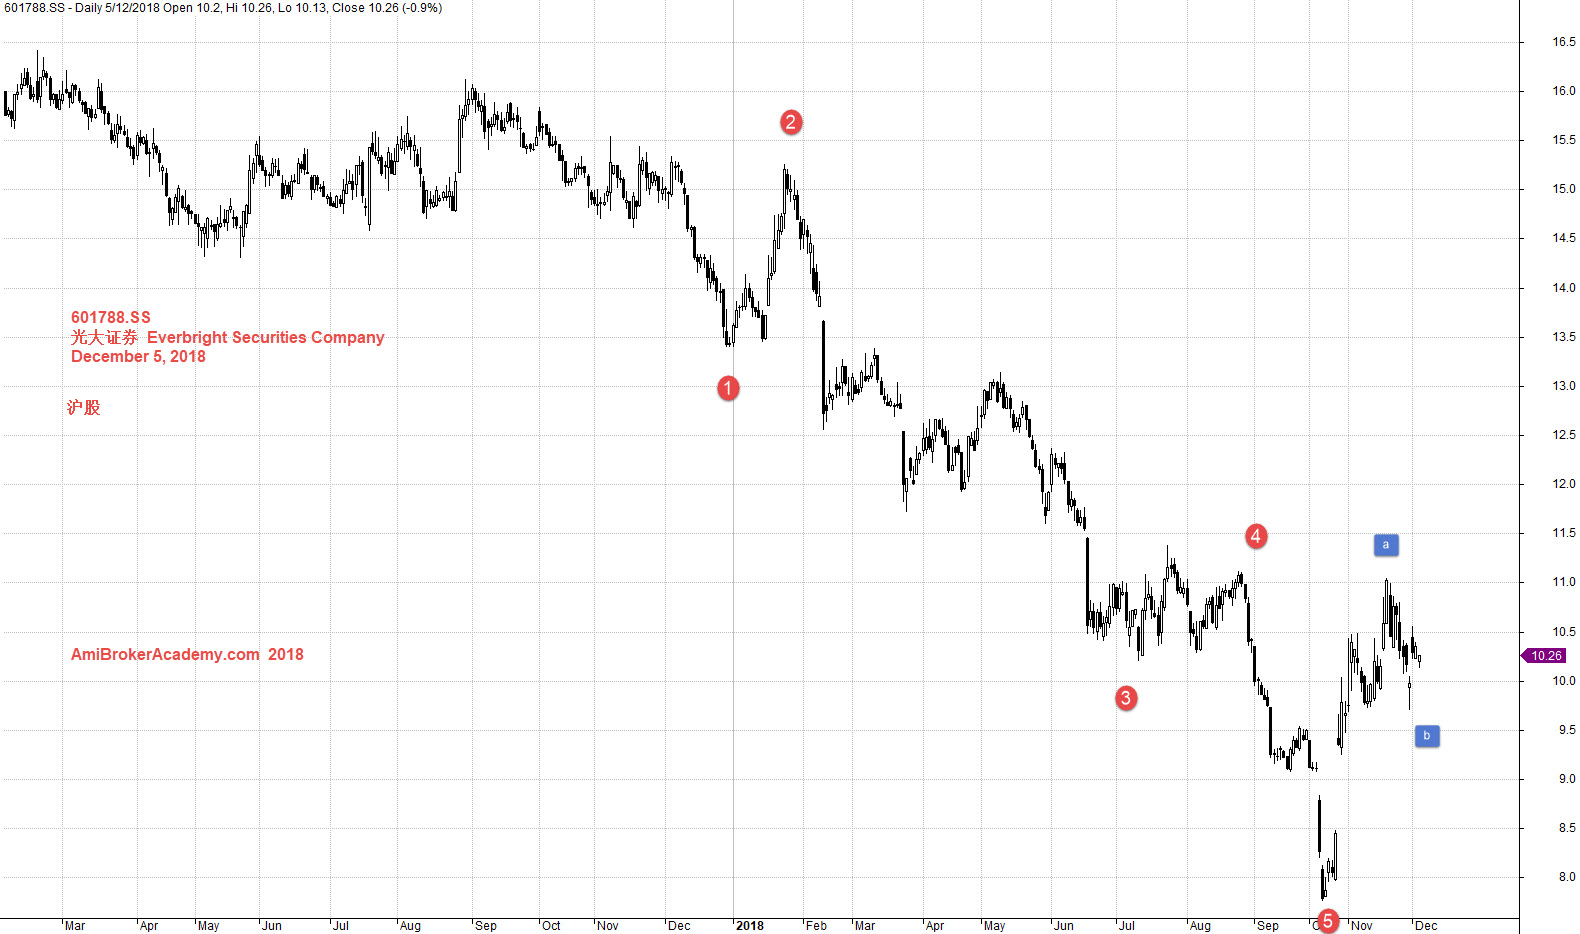
December 5, 2018 光大证券 Everbright Securities Company and Wave Count
Add MACD indicator, see chart. Stock price might be reversal. Trade with eyes open.
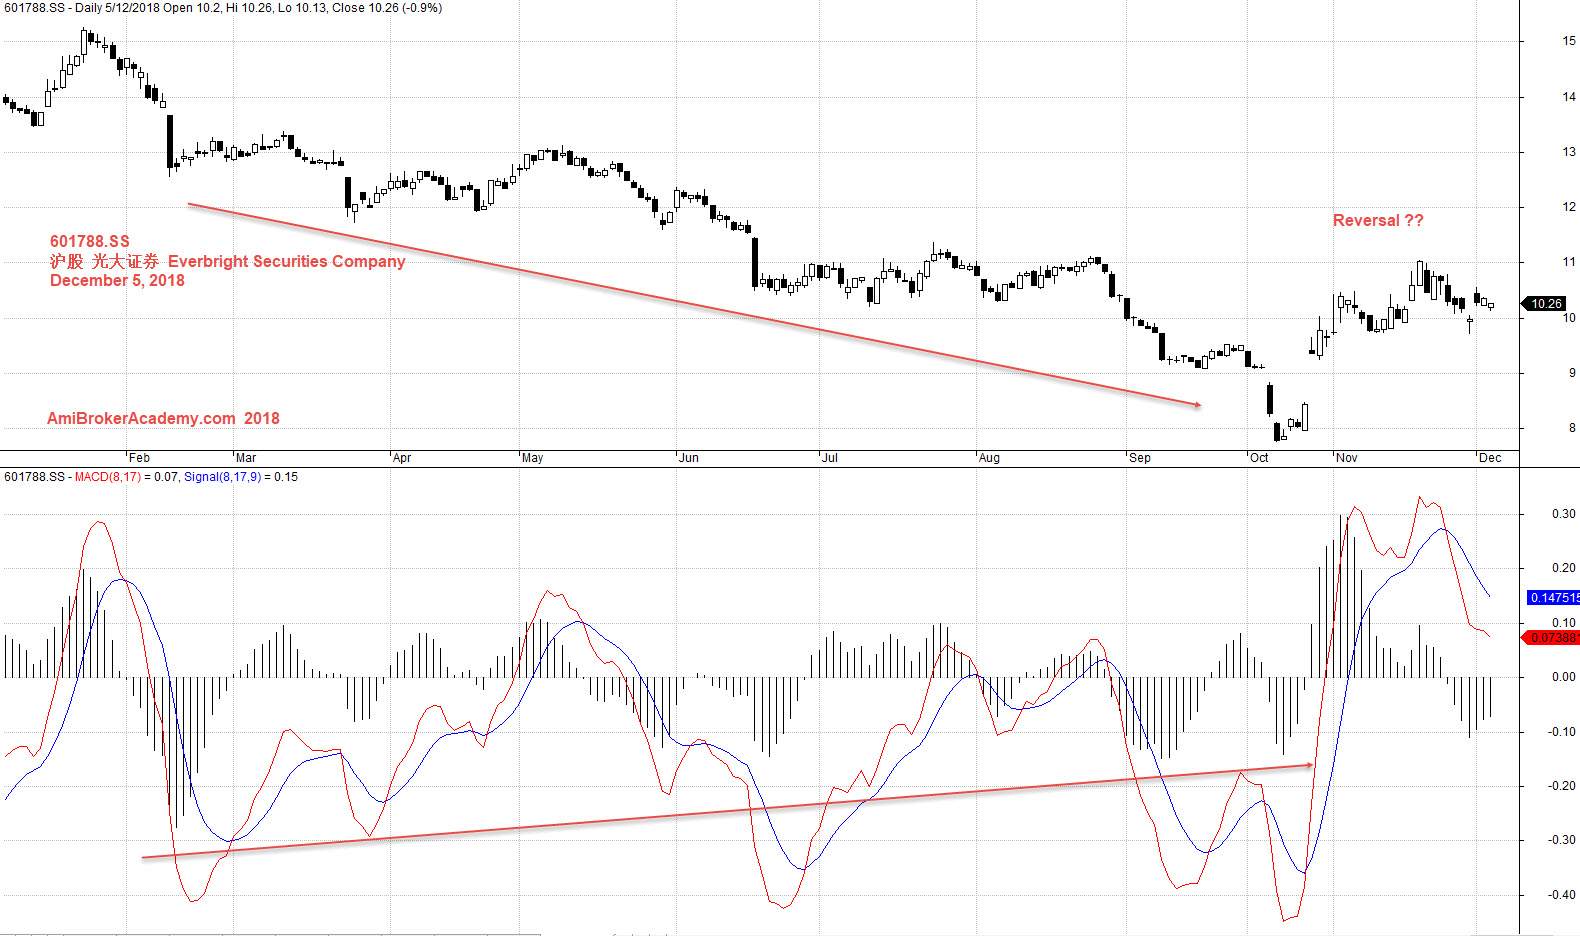
December 5, 2018 光大证券 Everbright Securities Company and MACD
Moses
AmiBrokerAcademy.com
Disclaimer
The above result is for illustration purpose. It is not meant to be used for buy or sell decision. We do not recommend any particular stocks. If particular stocks of such are mentioned, they are meant as demonstration of Amibroker as a powerful charting software and MACD. Amibroker can program to scan the stocks for buy and sell signals.
These are script generated signals. Not all scan results are shown here. The MACD signal should use with price action. Users must understand what MACD and price action are all about before using them. If necessary you should attend a course to learn more on Technical Analysis (TA) and Moving Average Convergence Divergence, MACD.
Once again, the website does not guarantee any results or investment return based on the information and instruction you have read here. It should be used as learning aids only and if you decide to trade real money, all trading decision should be your own.