November 21, 2018
Thanks for visiting the site.
There is a reason for everything. Perhaps at the moment you do not have the answer.
Moses Stock Analysis
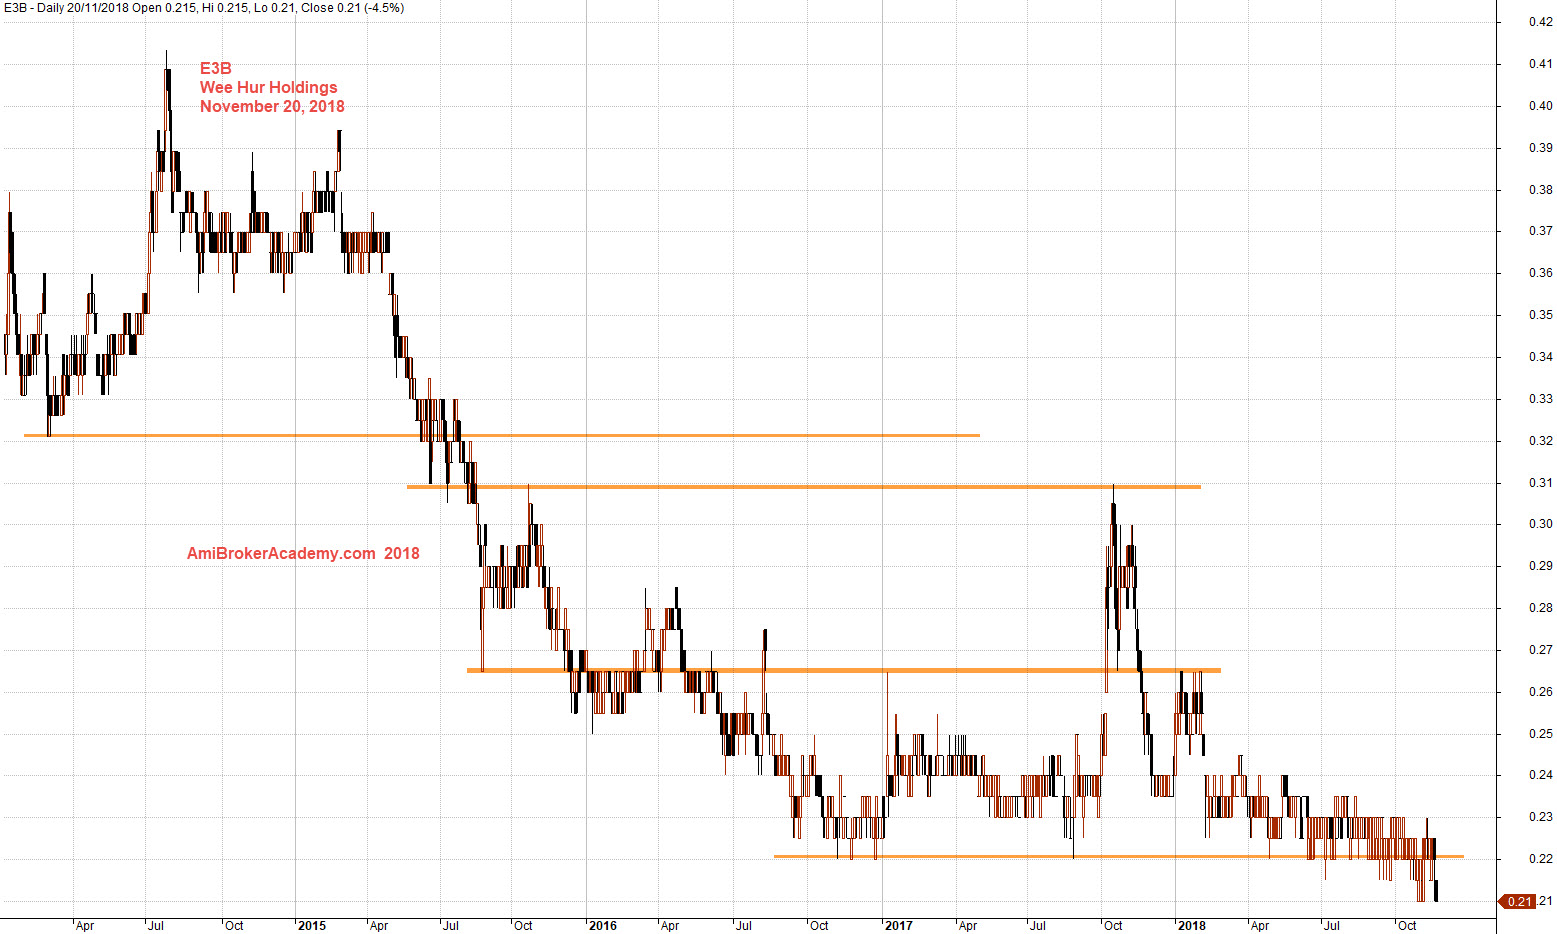
E3B Wee Hur Holdings Daily Charting
Buy low sell high, buy support sell resistance.
See chart, the price action of Wee Hur Holdings stock chart.
Apply buy low sell high and buy hold strategy, BHS. The price action moves up and test the high above 41 cents in 2014, and this is the best high of Wee Hur Holdings in this chart. The price action test the low below 22 cents. The price action continues to be supported by 22 cents level for eighteen months before breakout lower. 21 cents is the lower.
Trade with eyes open, manage your risk.
November 20, 2018 Wee Hur Holdings and Best Times
See chart, the best high is 56 cents for Wee Hur Holdings from 2008.
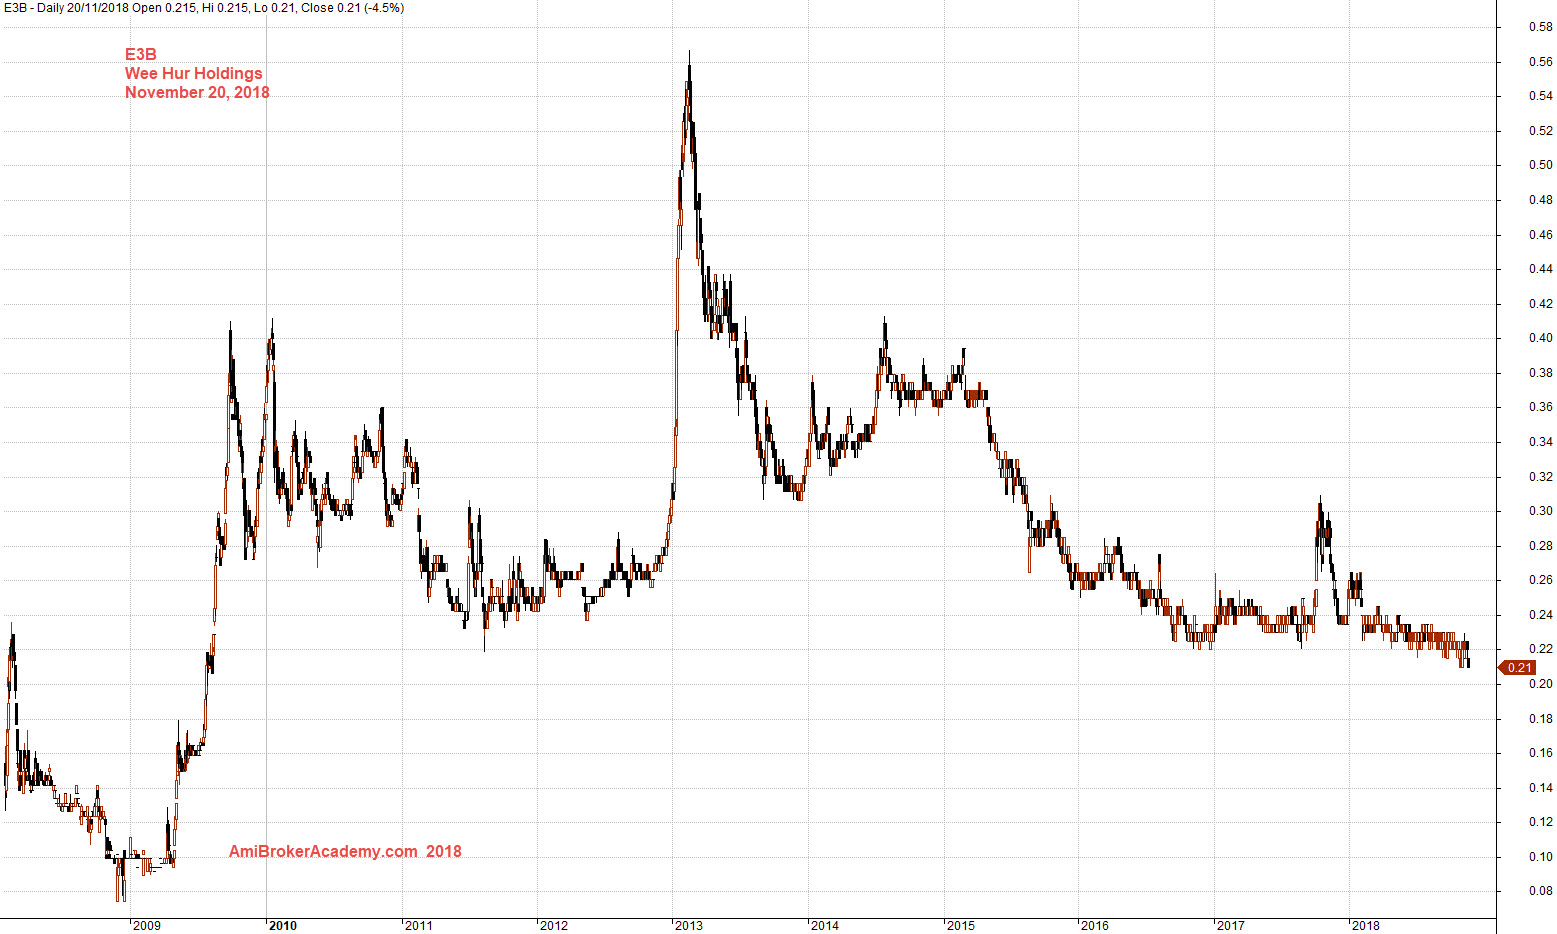
November 20, 2018 Wee Hur Holdings Charting
Moses
AmiBrokerAcademy.com
Disclaimer
The above result is for illustration purpose. It is not meant to be used for buy or sell decision. We do not recommend any particular stocks. If particular stocks of such are mentioned, they are meant as demonstration of Amibroker as a powerful charting software and MACD. Amibroker can program to scan the stocks for buy and sell signals.
These are script generated signals. Not all scan results are shown here. The MACD signal should use with price action. Users must understand what MACD and price action are all about before using them. If necessary you should attend a course to learn more on Technical Analysis (TA) and Moving Average Convergence Divergence, MACD.
Once again, the website does not guarantee any results or investment return based on the information and instruction you have read here. It should be used as learning aids only and if you decide to trade real money, all trading decision should be your own.