April 18, 2019
Welcome to AmiBrokerAcademy.com. Thanks for visiting the site.
We interpreting the markets emotion, price action using patterns and indicators. Hope this make sense to you. Have fun!
CMG Chipotle Mexican Grill Stock Charting
Study CMG Chipotle Mexican Grill Inc Stock chart.
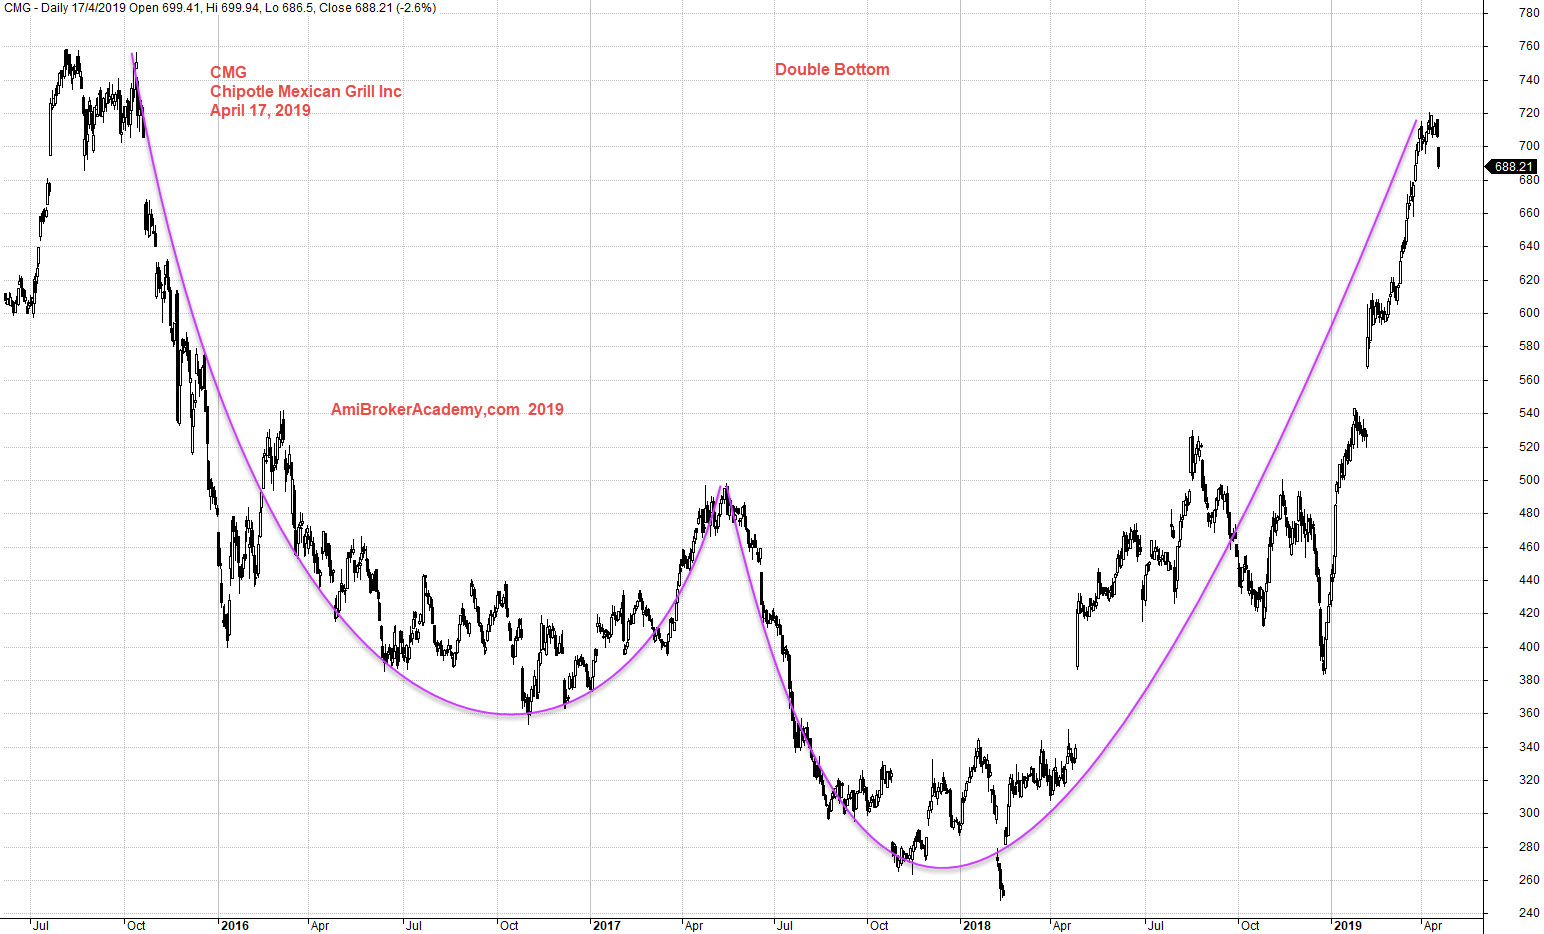
See chart, picture worth a thousand words.
Price action after the peak near 760 dollars, price action pullback and push up again follow the H M Gartley abcd pattern to retest 760 dollars. Thereafter the price action fail to hit the bottom at 400 dollars.
Bull regain control and test the high at 540 dollars, which is very far from the 760 dollars. The bear kicks in again, push the price action to another low. The low lower than the last low and touch 360 dollars.
After much try, see chart the price action return to the high at 500 dollars. That seems to be the best high so far in 2017. The price action then again fall further low. Now the low hits below 260 dollars. Wow, the price action has swing from as high as 760 dollars to the low below 260 dollars, a half thousand lower. This is the lower in 2018.
When you study carefully, you will see the double bottom. And if you are H M Gartley fan, you will find many ABCD pattern too.
Price action begin a bull abcd pattern up, now the price action hit 720 dollars and fall. Can the price action continue to push higher? Will see.
Trade with your eyes open.
Moses Stock Observation
Moses Stock Analysis
AmiBrokerAcademy.com
Disclaimer
Disclaimer
The above result is for illustration purpose. It is not meant to be used for buy or sell decision. We do not recommend any particular stocks. If particular stocks of such are mentioned, they are meant as demonstration of Amibroker as a powerful charting software and MACD. Amibroker can program to scan the stocks for buy and sell signals.
These are script generated signals. Not all scan results are shown here. The MACD signal should use with price action. Users must understand what MACD and price action are all about before using them. If necessary you should attend a course to learn more on Technical Analysis (TA) and Moving Average Convergence Divergence, MACD.
Once again, the website does not guarantee any results or investment return based on the information and instruction you have read here. It should be used as learning aids only and if you decide to trade real money, all trading decision should be your own.