23 August, 2018
Thanks for visiting the site.
We ask a question on the buy and hold strategy in our previous posting. Is the strategy dead?
^GSPC S&P 500 Index Charting
See chart, picture worth a thousand words. Study S&P 500 Index. Look left and we see the price action is retesting the the last peak level, 2900. Can the price action continue to be bullish? Will see. The last two bars were not promising, a Gravestone, and a doji. This is an indication of indecision. The market emotions are not convince on the bullish trending. True or true? Trade with eyes open. Should you continue to hold or maximum or profit if you have hold till now. Manage your risk.
So far this is a buy and hold strategy success case.

August 22, 2018 S&P 500 Index and Resistance
^GSPC S&P 500 Index Charting and MACD
Picture worth a thousand words, see chart for more.
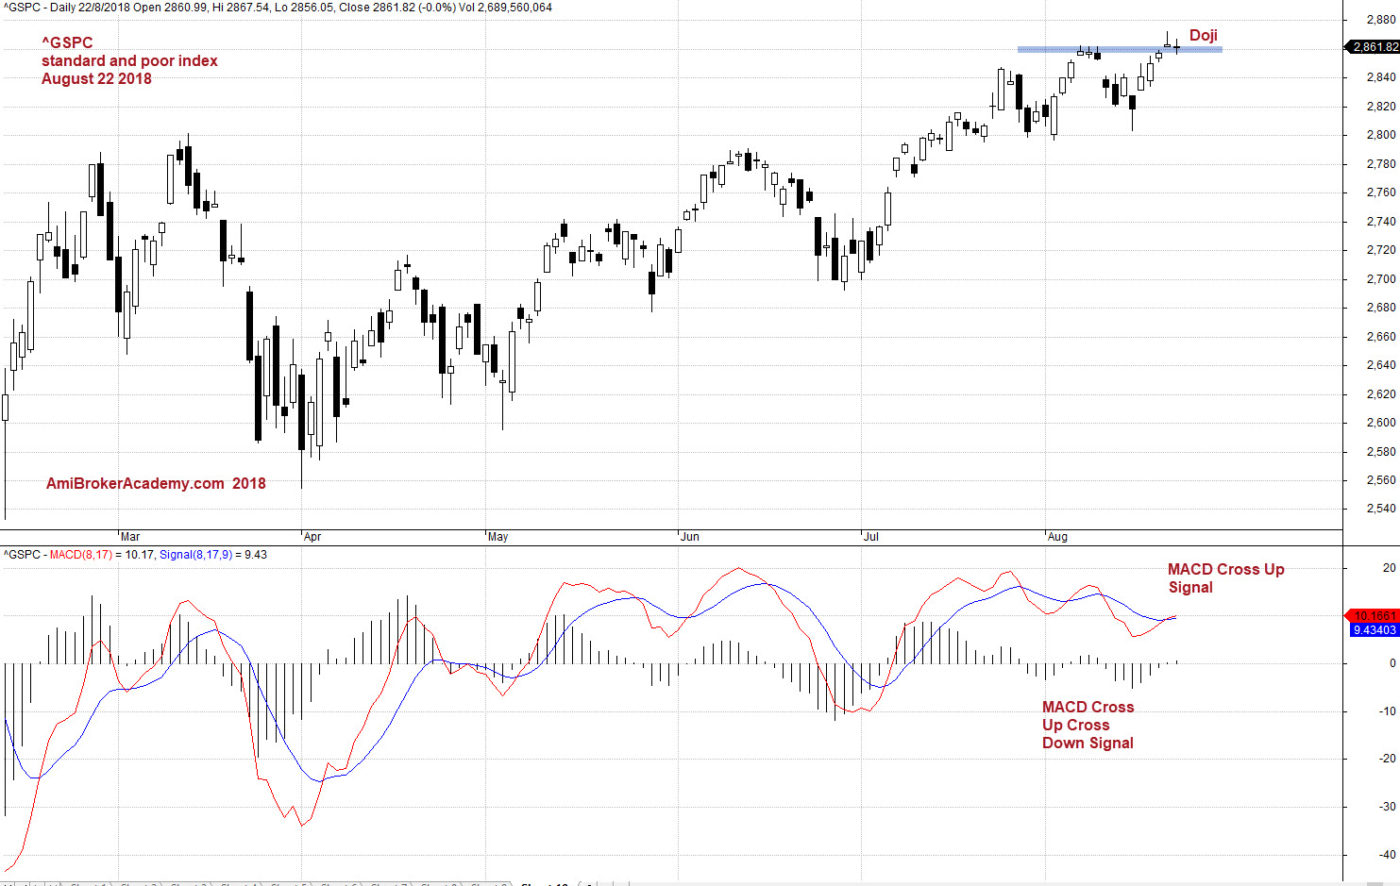
August 22, 2018 S&P 500 Index and MACD
Moses US Stock Chart Analysis
AmiBrokerAcademy.com
Disclaimer
The above result is for illustration purpose. It is not meant to be used for buy or sell decision. We do not recommend any particular stocks. If particular stocks of such are mentioned, they are meant as demonstration of Amibroker as a powerful charting software and MACD. Amibroker can program to scan the stocks for buy and sell signals.
These are script generated signals. Not all scan results are shown here. The MACD signal should use with price action. Users must understand what MACD and price action are all about before using them. If necessary you should attend a course to learn more on Technical Analysis (TA) and Moving Average Convergence Divergence, MACD.
Once again, the website does not guarantee any results or investment return based on the information and instruction you have read here. It should be used as learning aids only and if you decide to trade real money, all trading decision should be your own.