December 6, 2019
Welcome to AmiBrokerAcademy.com. Thanks for visiting the site.
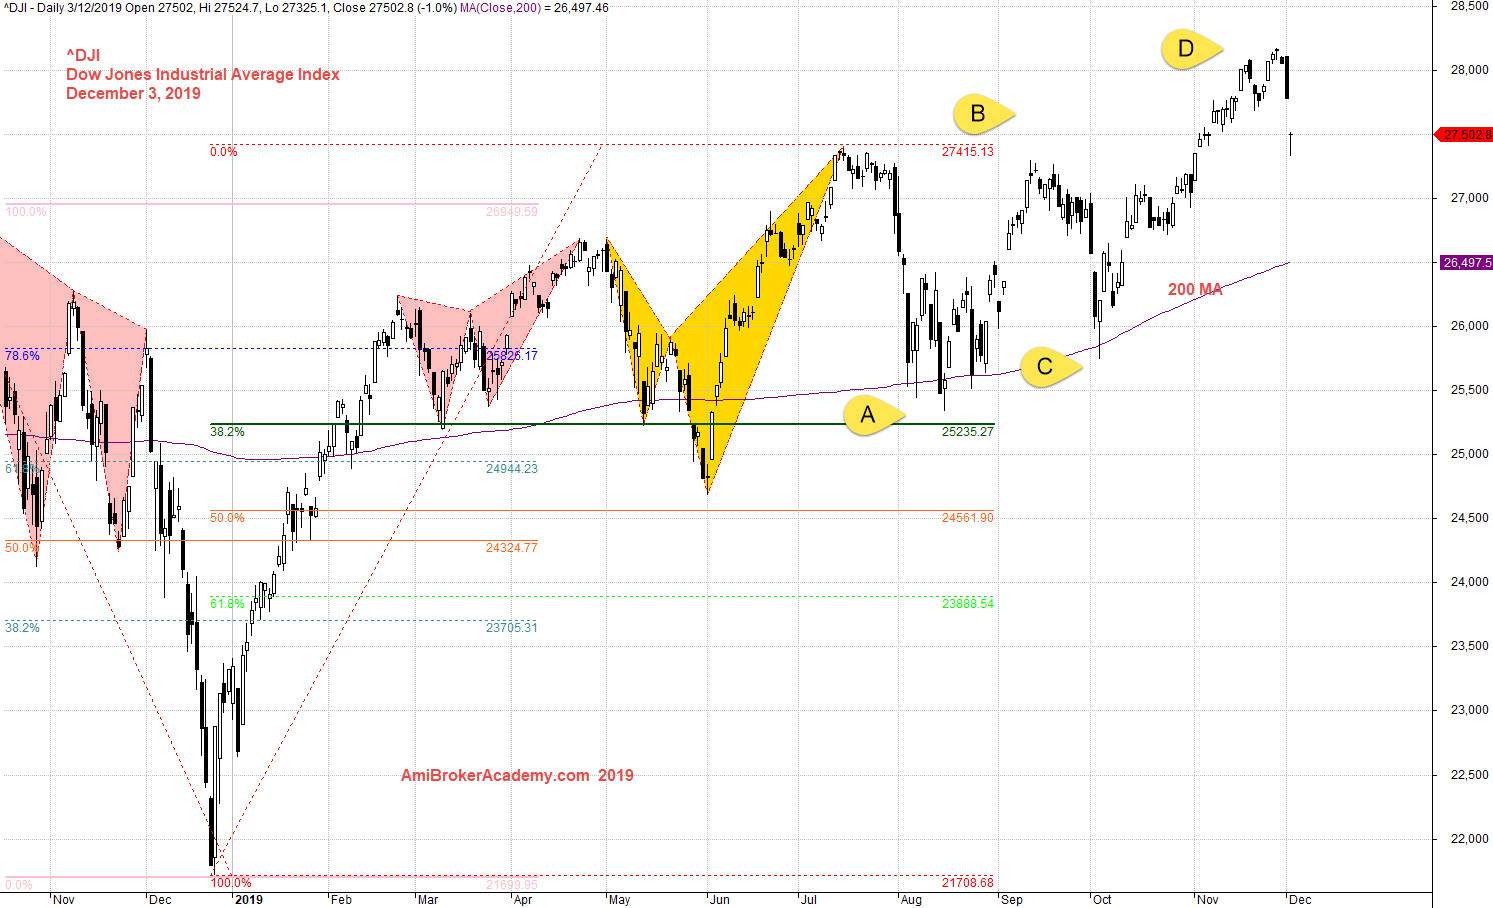
^DJI Dow Jones Industrial Average Index Stock Charting
Study Dow Jones Industrial Average Indexstock chart and price action and Fibonacci.
Look left and think right. Manage your expectation.
See chart, picture worth a thousand words.
Swing low to high, and see the price action has finally breakout the resistance. See chart.
Dow Jones Industrial Average dropped Monday, on the first trading day of December, as investors disappointed by manufacturing data along with the latest trade news about the trade war with China.
You can see the bull ABCD seem to complete CD leg. The decline seems expected.
Trade with eyes open.
Moses Stock Observation
AmiBrokerAcademy.com
Disclaimer
The above result is for illustration purpose. It is not meant to be used for buy or sell decision. We do not recommend any particular stocks. If particular stocks of such are mentioned, they are meant as demonstration of Amibroker as a powerful charting software and MACD. Amibroker can program to scan the stocks for buy and sell signals.
These are script generated signals. Not all scan results are shown here. The MACD signal should use with price action. Users must understand what MACD and price action are all about before using them. If necessary you should attend a course to learn more on Technical Analysis (TA) and Moving Average Convergence Divergence, MACD.
Once again, the website does not guarantee any results or investment return based on the information and instruction you have read here. It should be used as learning aids only and if you decide to trade real money, all trading decision should be your own.