3 January 2021
Welcome!
Welcome to AmiBroker Academy dot com. Thanks for the search and landed yourself here. We believe your would return. We use organic search to surface this site. If you find the site through some keywords. We would like to congratulate you, like mind think the same. Good job and have fun!
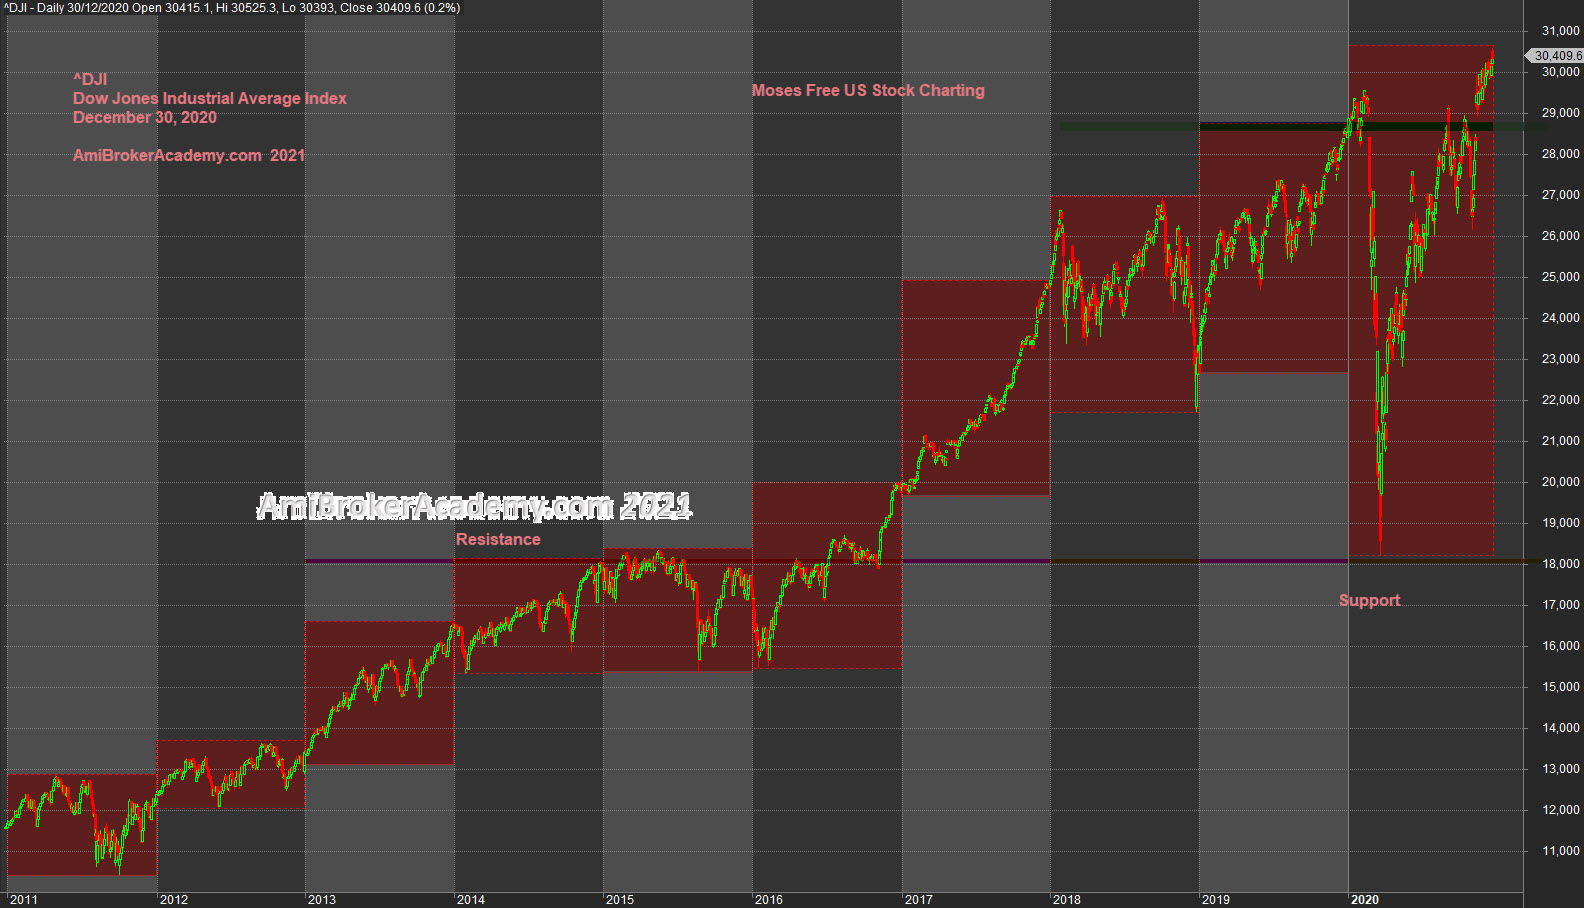
Dow Jones Industrial Average Index Charting from 2011
Picture worth a thousand words, see chart. 2020 is a volatile year, relative to the last ten years. Why? From boxes, it has the biggest box, means the year high and low are far far aport.
Year 2020 low is lower than 2019, 2018 and 2017 year low. Year 2020 low retest the high of year 2014 and 2015.
See chart, needless to explain from the boxes chart below.
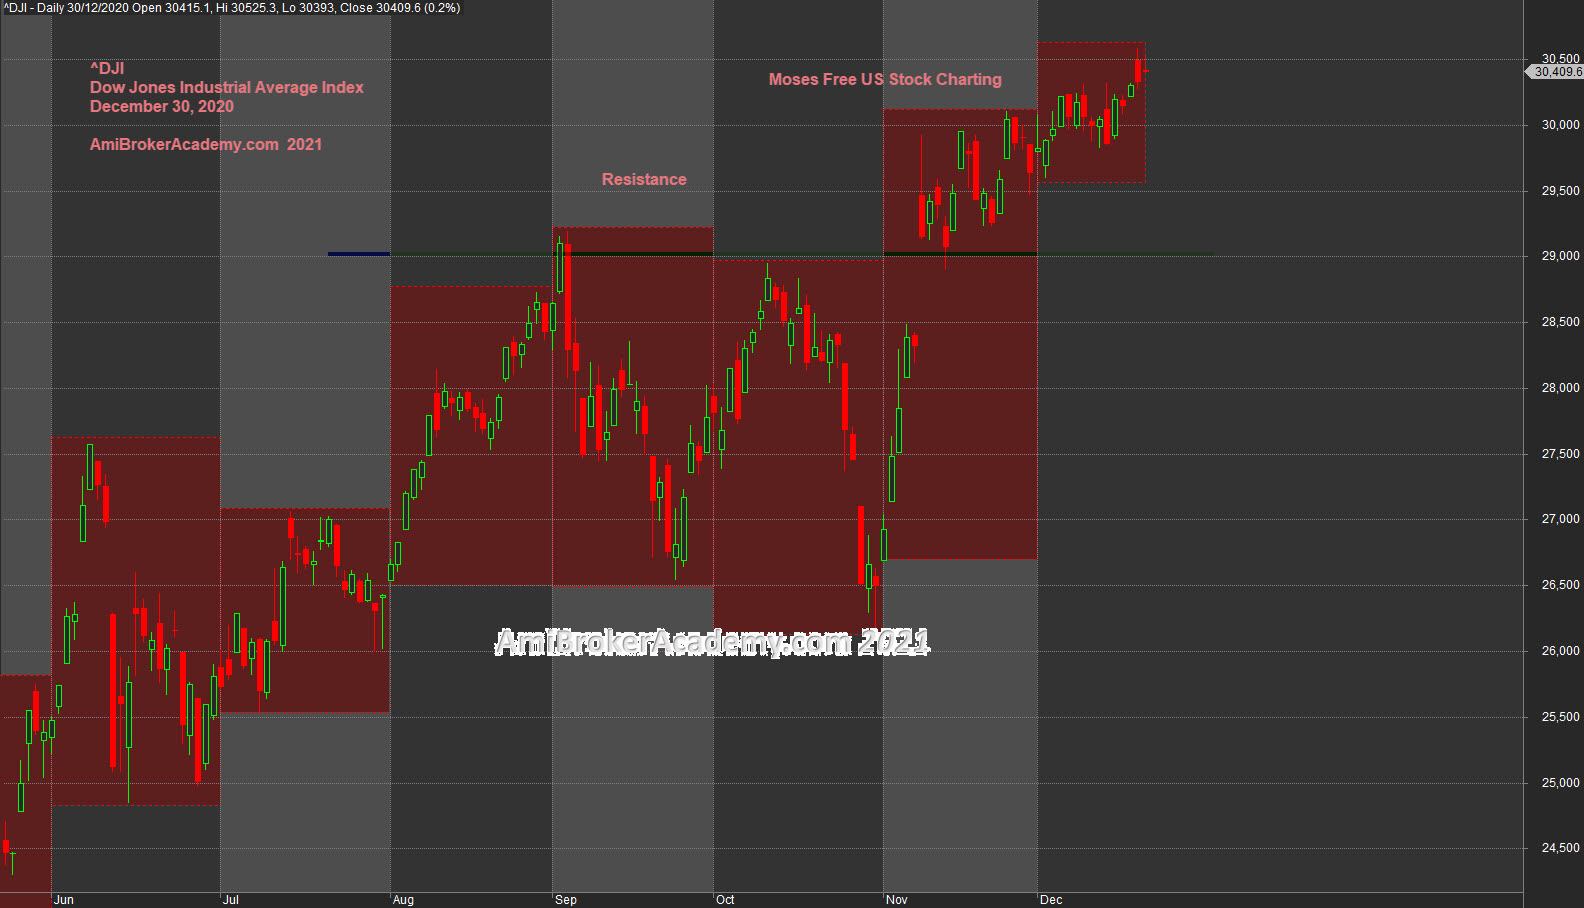
Price Action has rebounced to retest 2019 high, and breakout higher.
Now what’s next year like?
Have fun!
^DJI Charting with Twenty Four Months Data
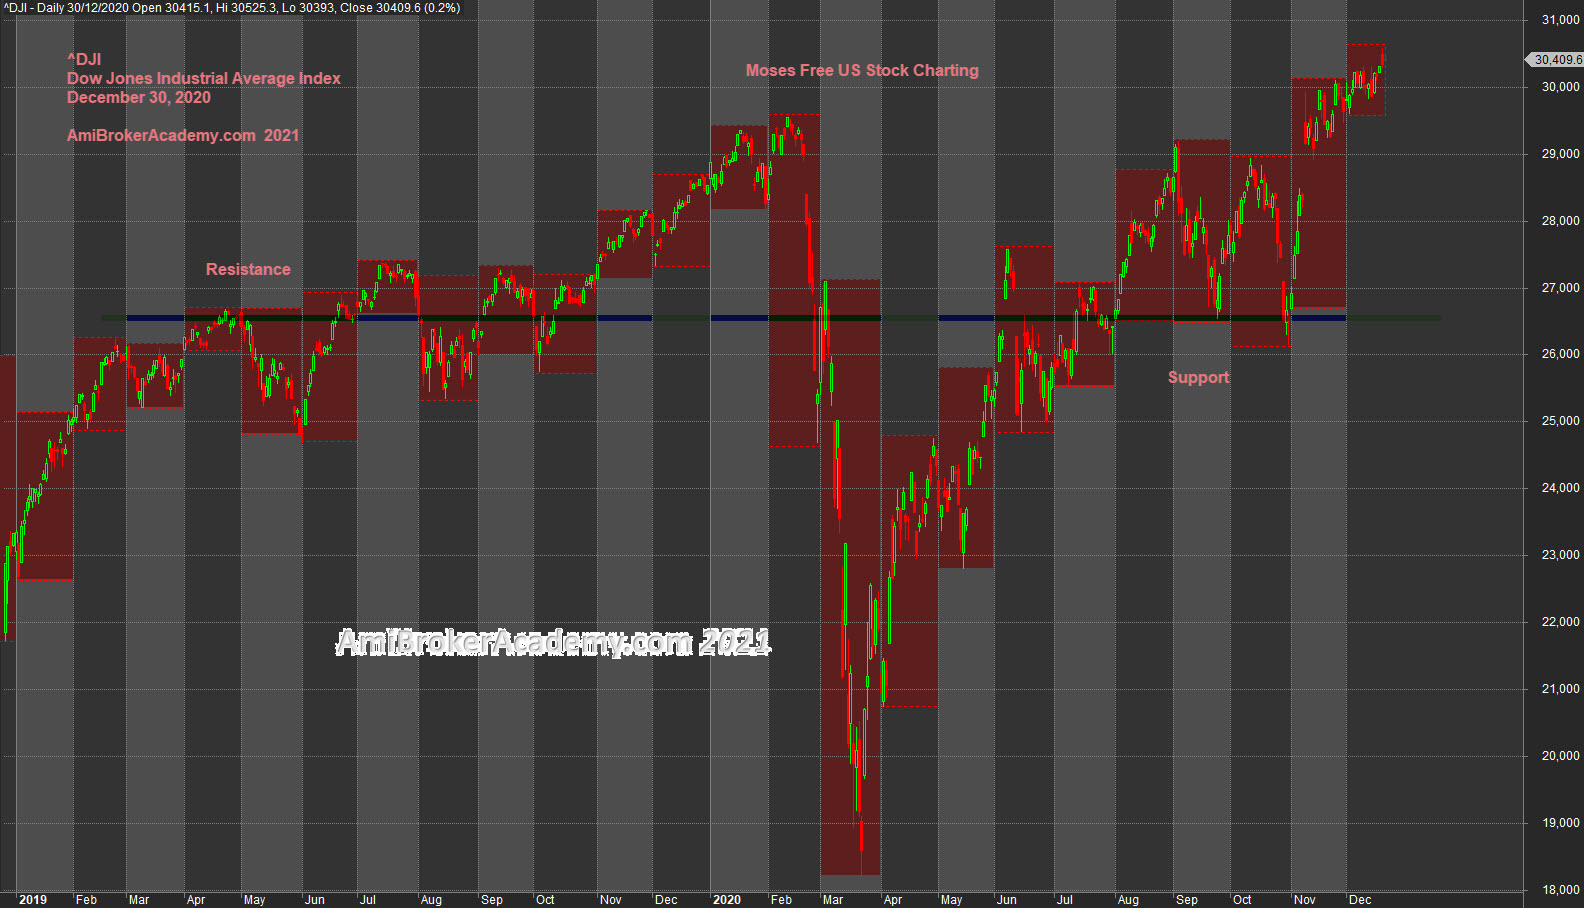
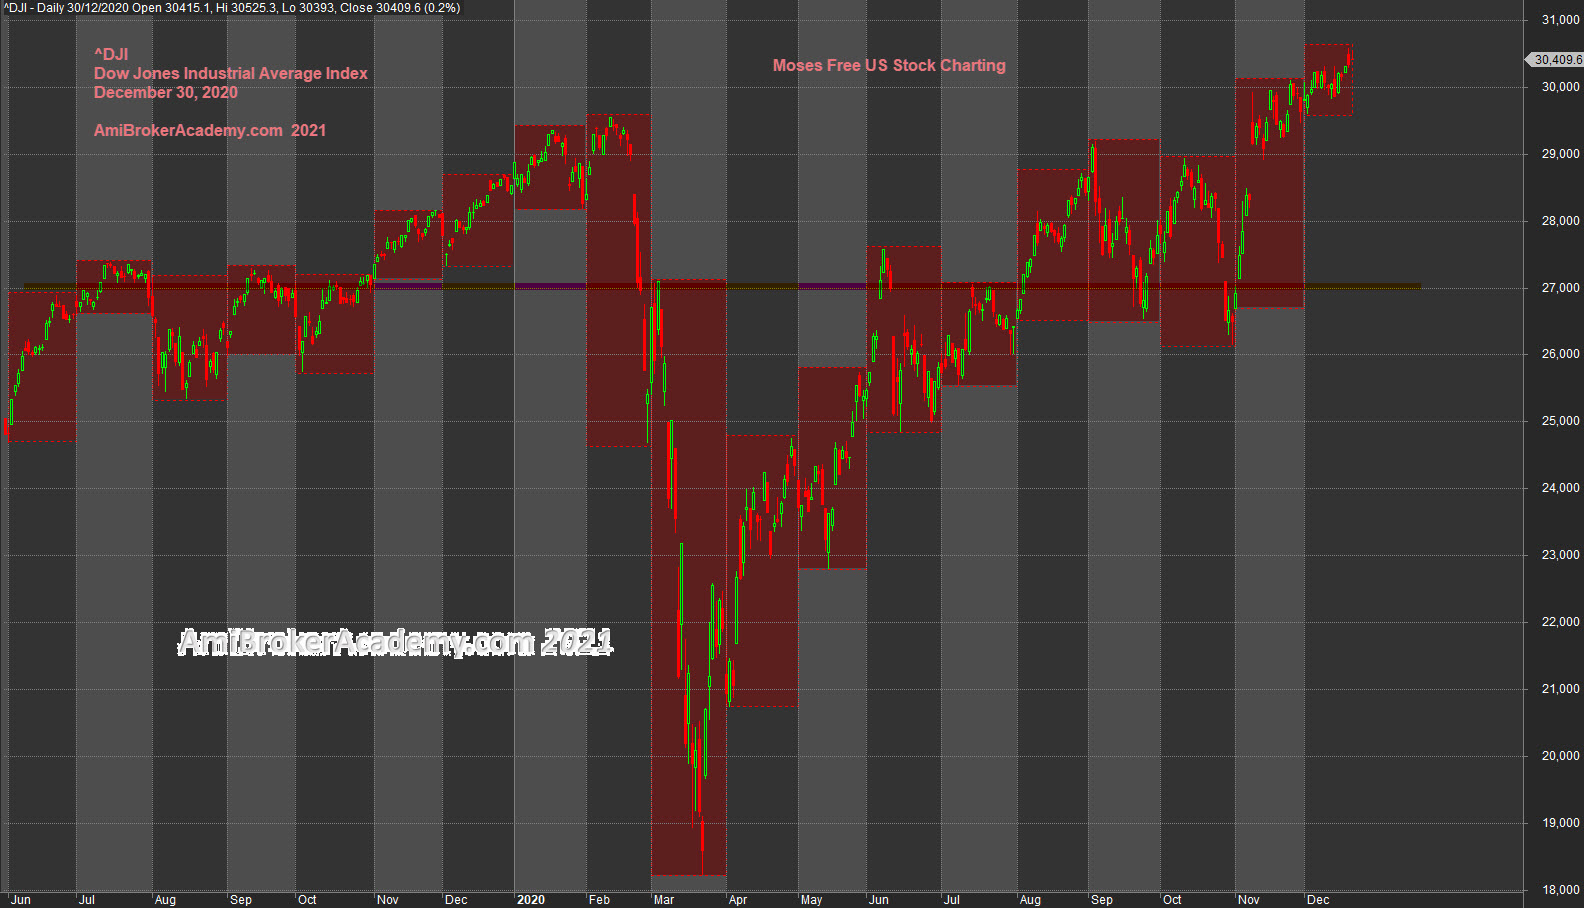
Dow Jones Industrial Average Index Charting and Eighteen Months Data
Crude Oil Charting and Twelve Months Data
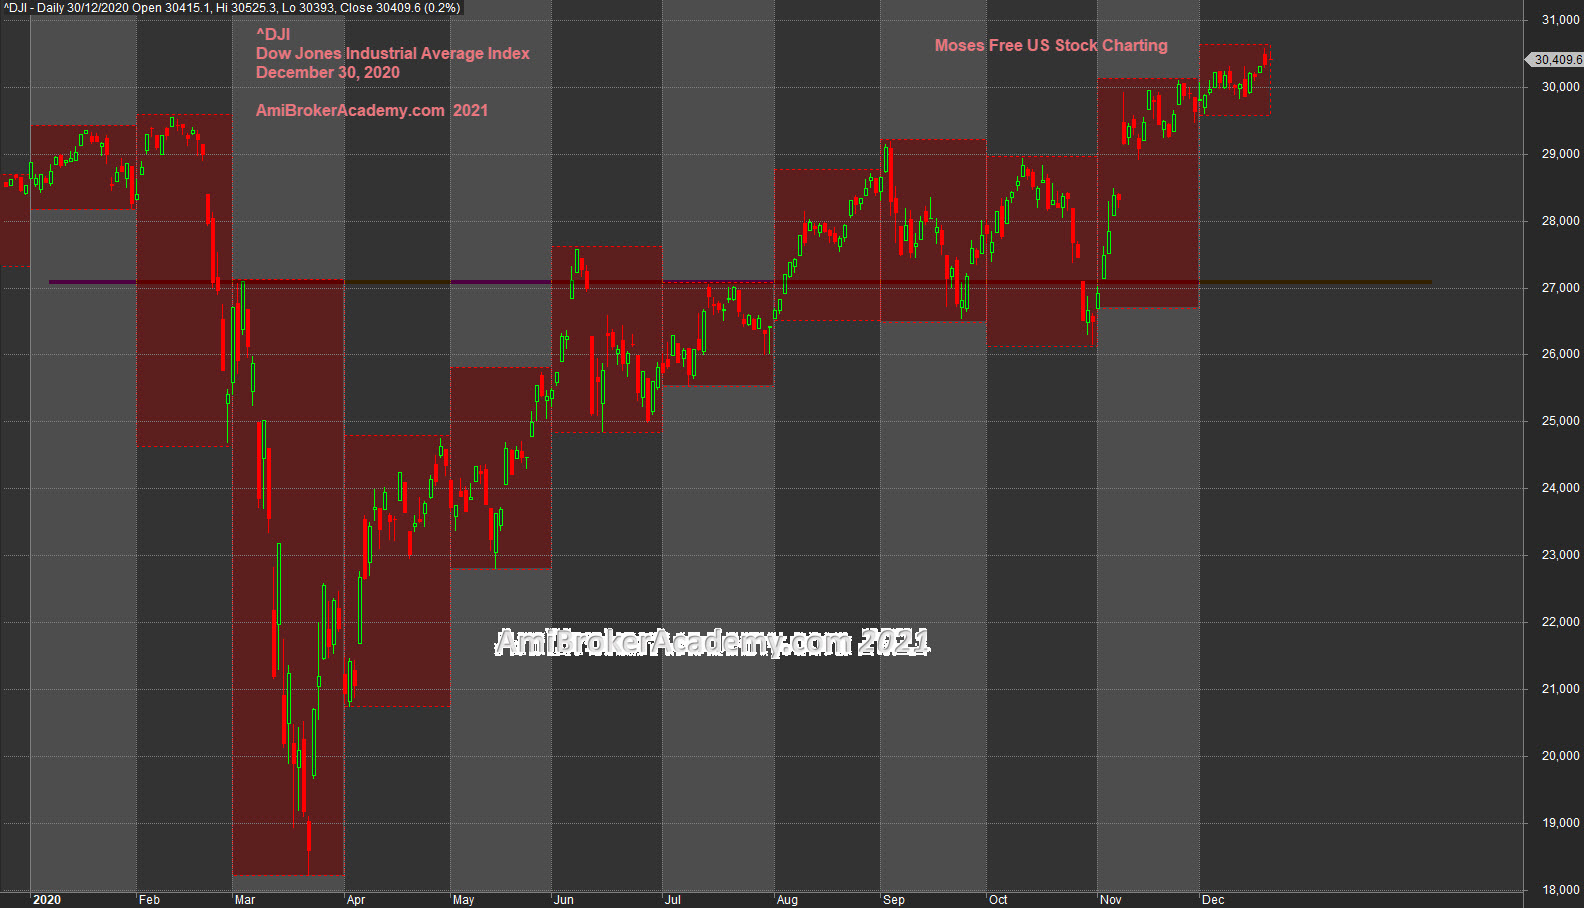
^DJI | Dow Jones Industrial Average Index Charting and Six Months Data
Manage your risk.
Picture Worth a Thousand Words
Moses Free Stock Charting
Official AmiBrokerAcademy.com Charting
Disclaimer
The above result is for illustration purpose. It is not meant to be used for buy or sell decision. We do not recommend any particular stocks. If particular stocks of such are mentioned, they are meant as demonstration of Amibroker as a powerful charting software and MACD. Amibroker can program to scan the stocks for buy and sell signals.
These are script generated signals. Not all scan results are shown here. The MACD signal should use with price action. Users must understand what MACD and price action are all about before using them. If necessary you should attend a course to learn more on Technical Analysis (TA) and Moving Average Convergence Divergence, MACD.
Once again, the website does not guarantee any results or investment return based on the information and instruction you have read here. It should be used as learning aids only and if you decide to trade real money, all trading decision should be your own.
We learn from many past and present great traders. Kudo to these master.
Side Notes:
You can copy our chart or charts for free, but you can’t copy our mind. Have fun! If you are reference to our chart or charts for whatever good use, please compliment us; indicate where the chart or charts from. We appreciate your kindness gesture. Many may find some of our chart or charts in some of the very interesting site, pxxxxxxest