22 June 2018
Thanks for visiting the site.
We studied ^KS11 and 000001.SS stock index and Trump-Kim Summit correlation. Now, let’s study U.S. stock market index such as Dow Jones Index.
From CNBC, we know the Italian banks raise, see the link in our previous posting.
Moses Stock Market Analysis
^DJI Dow Jones Industrial Average Index Charting
Now ten days after, let study U.S. Dow Jones Index. See chart, the market continue the bullish trend, except the market started to drift south after the Trump-Kim Submit at Singapore. Picture worth a thousand words, see chart for the drifting south.
Mange your risk.
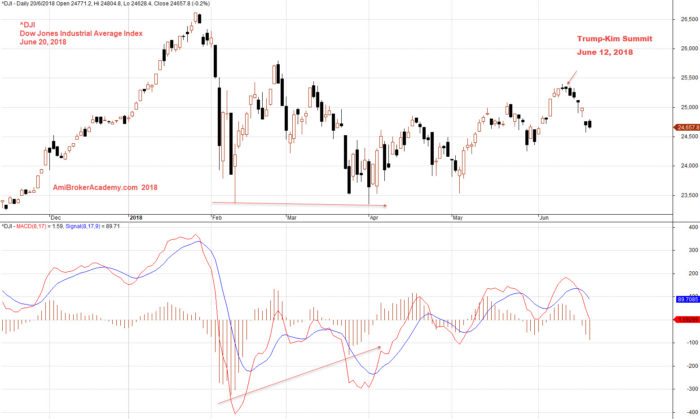
June 20, 2018 Dow Jones Industrial Average Index and MACD
Moses Stock Chart Analysis
AmiBrokerAcademy.com
Disclaimer
The above result is for illustration purpose. It is not meant to be used for buy or sell decision. We do not recommend any particular stocks. If particular stocks of such are mentioned, they are meant as demonstration of Amibroker as a powerful charting software and MACD. Amibroker can program to scan the stocks for buy and sell signals.
These are script generated signals. Not all scan results are shown here. The MACD signal should use with price action. Users must understand what MACD and price action are all about before using them. If necessary you should attend a course to learn more on Technical Analysis (TA) and Moving Average Convergence Divergence, MACD.
Once again, the website does not guarantee any results or investment return based on the information and instruction you have read here. It should be used as learning aids only and if you decide to trade real money, all trading decision should be your own.