13 September 2021
Welcome!
Welcome to AmiBroker Academy dot com, amibrokeracademy.com.
This is not a site that provides buy or sell signals. We only read the stock chart bar by bar.
Buy or Sell, you decide.
Trading is all probability. The price action is either up, down or sideways.
Trade what you see. Manage your risk.
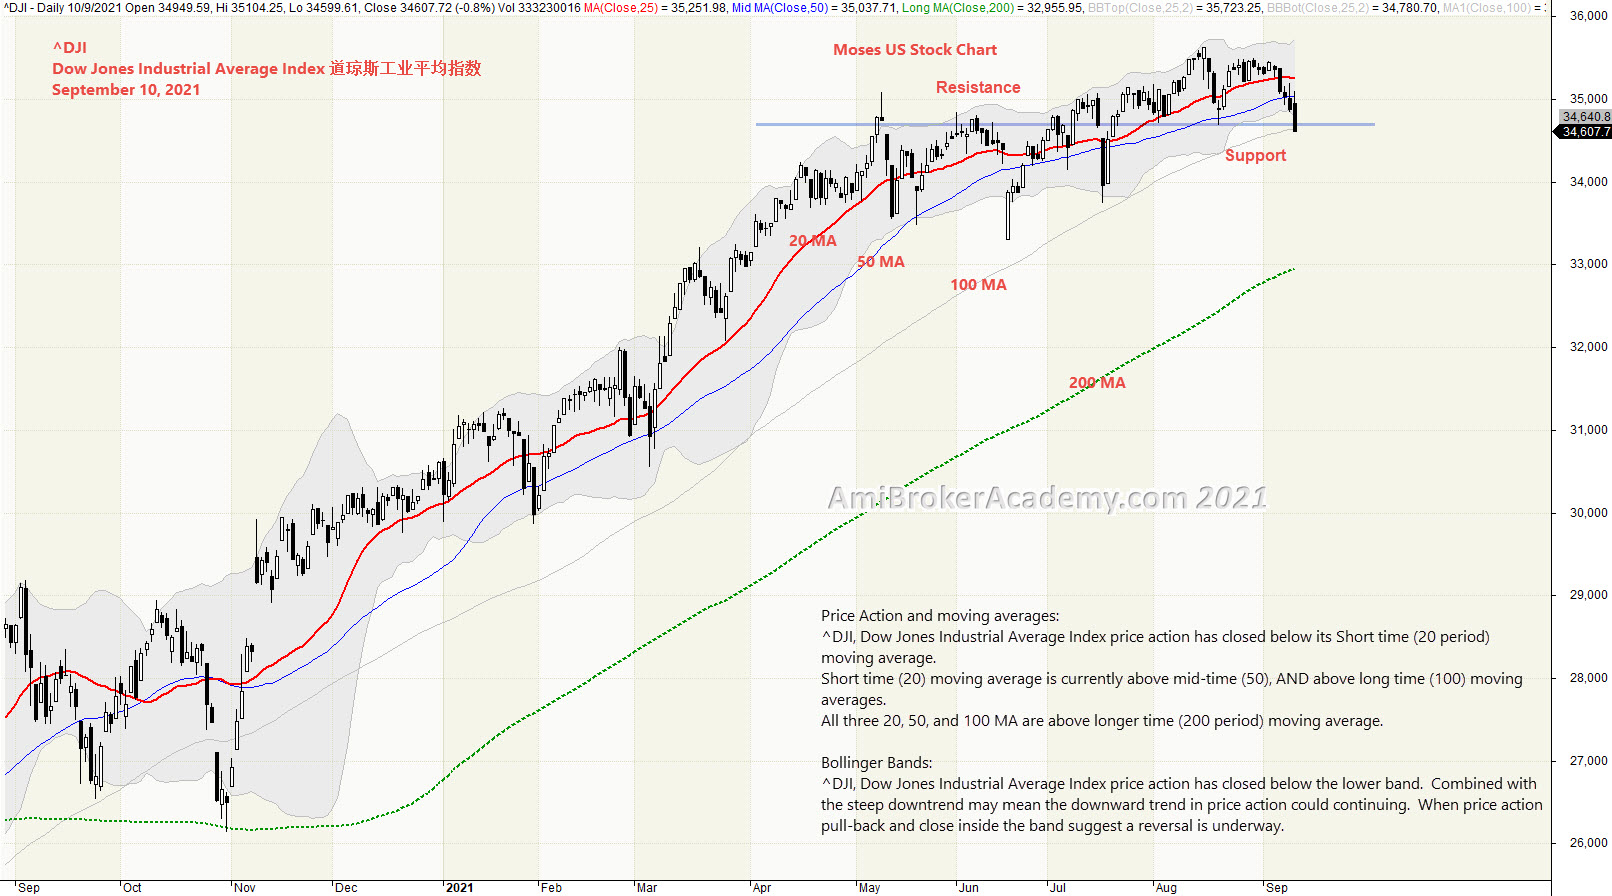
1) Dow Jones Industrial Average Index 道指数 and Bollinger Bands and Moving Averages
Picture worth a thousand words.
Moses Power Charting
Official AmiBrokerAcademy.com Charting
Disclaimer
The above result is for illustration purpose. It is meant to be used for learning buy or sell signals. We do not recommend for any particular stocks. If particular stocks of such are mentioned, they are meant as a demonstration of Amibroker as a powerful charting software. Amibroker is a charting software, it can program to scan the stocks for buy and sell signals. Or backtest for any trading strategy or technique.
We post script generated signals. Not all scan results are shown here depending on selection criterial. The MACD signal should use with price action. Users must understand what MACD and price action are all about before using them. If necessary you should attend a course to learn more on Technical Analysis (TA) and Moving Average Convergence Divergence, MACD.
Once again, the website does not guarantee any results or investment return based on the information and instruction you have read here. It should be used as learning aids only and if you decide to trade real money, all trading decision should be your own.
We learn from many past and present great traders. Kudo to these master.