March 3, 2018
Dow Drops More Than 400 Points After Trump Announces Tariffs on Thursday March 1
In our last posting on MSFT, we see there is a potential for the price action to test 127% level on Fibonacci Extension, but we also caution all to manage the risk as all set up can fail. Besides there are many reason to cause the market emotions to think the price is too high. Now there was a good reason for the market to drop the price, and into the possible second phase of correction. See the above story from the money.cnn.com.
Powerful Chart Software – AmiBroker
The following chart is produced using AmiBroker charting software. It is a powerful chart software. You plot the stocks you are interested all in one chart, as long as you still could read them.
US Stock Analysis
^DJI Dow Jones Industrial Average had Deep More than 400 Points …
Study chart for more, picture worth a thousand words. We see the Dow had made a phase 1 correction, followed by a rebounce, than pull back again. This is similar to a dead cat bounce, as it may need a bit more time to complete the dead cat bounce.
When can Dow back to 26,500 level? Soon or never. Will see.
Manage your risk.
Remember Don’t Take the Prediction At Face Value
Do your own analysis?
Manage your risk!
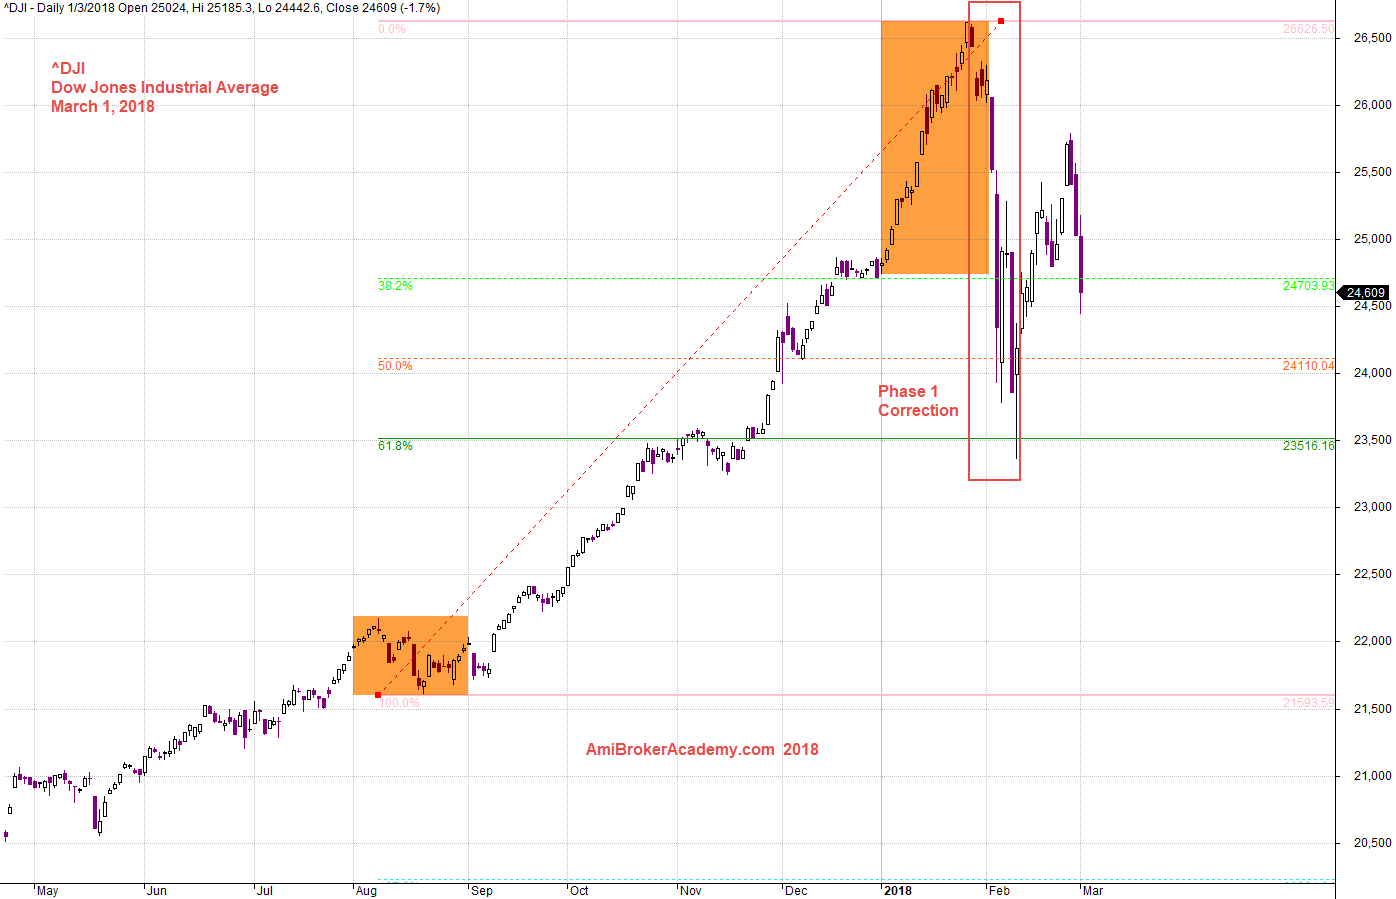
Marcj 1, 2018 Dow Jones Industrial Average and Phase 1 Correction
Dow Jones Industrial Average and Low High
See chart for more, Dow has completed a low high.
20180301 Dow Jones Industrial Average and Fibo Retracement Swin High to Low
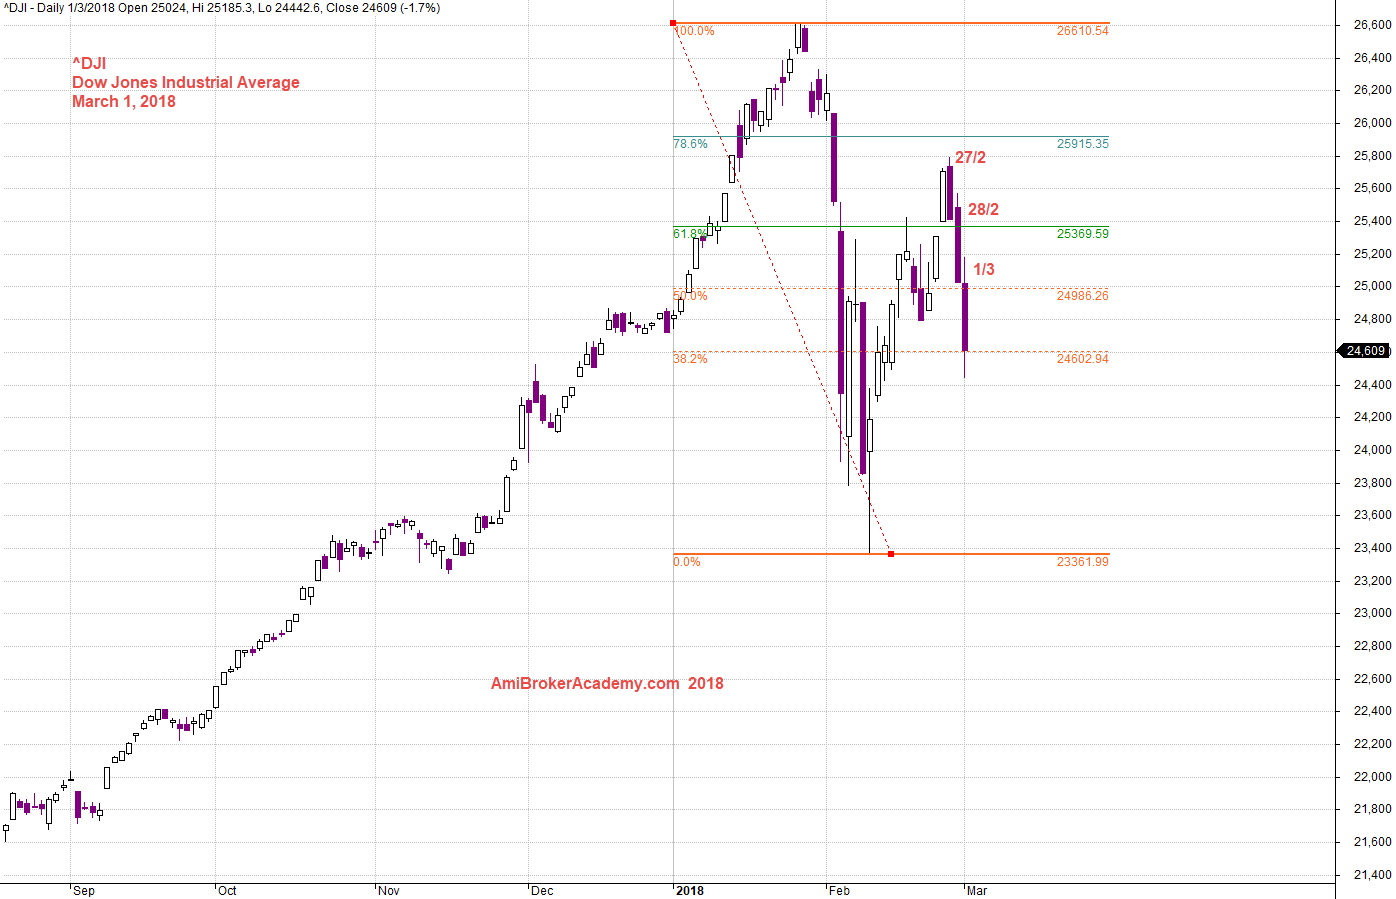
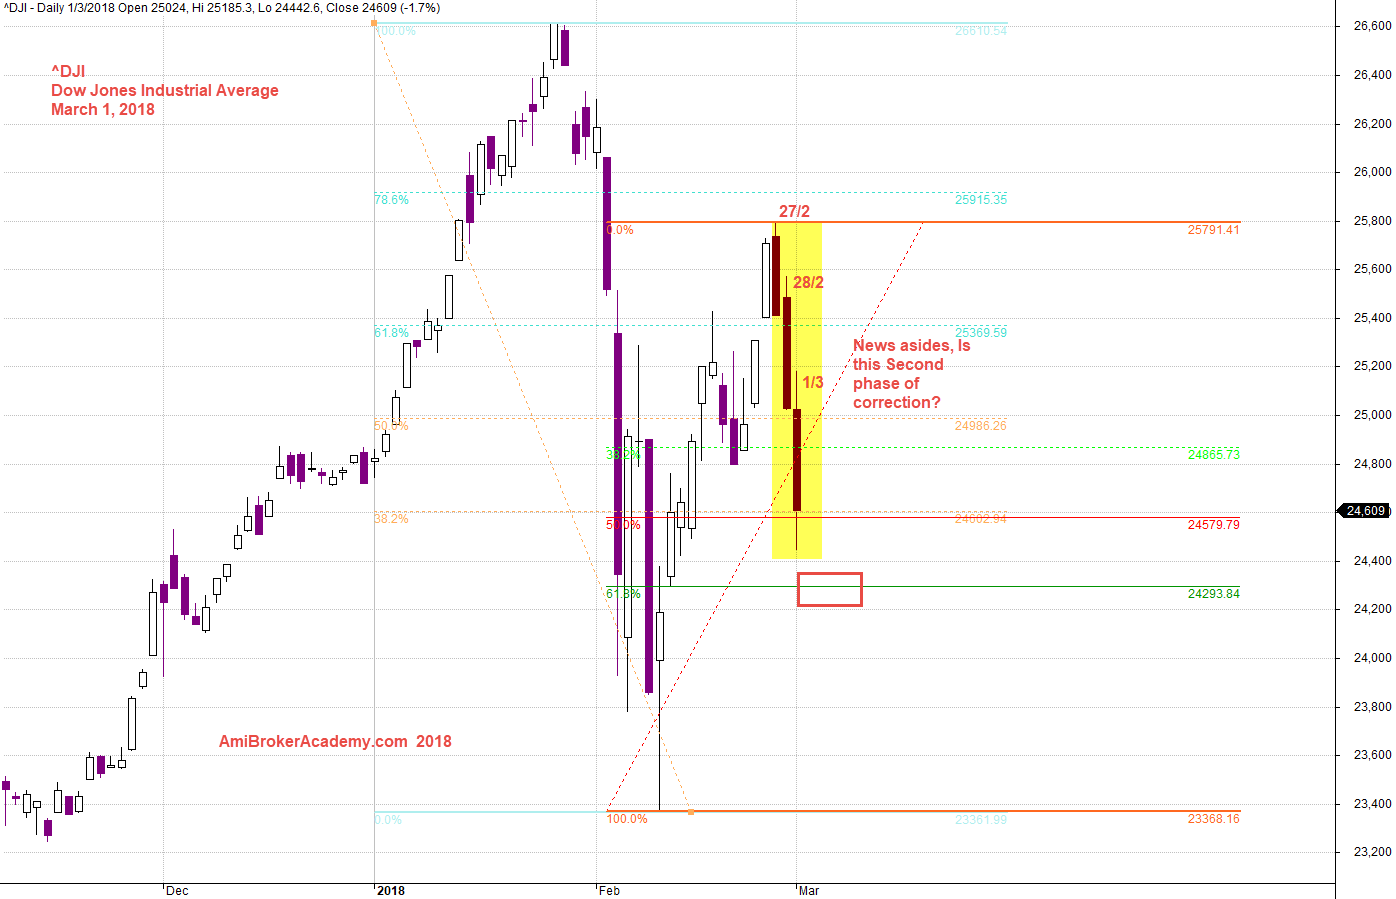
Dow Jones Industrial Average into Second Phase of Correction
See chart for more, is Dow into the second phase of correction? Manage your risk.
20180301 Dow Jones Industrial Average and Fibo Retracement High to Low Correction
Dow Jones Industrial Average into Second Phase of Correction
Investor caught off guard from Trump’s new controversial tariff announcement, on Thursday March 1. Dow response in drop more than 400 points, read news report from the money.cnn.com.
See chart for more.
Manage your risk.
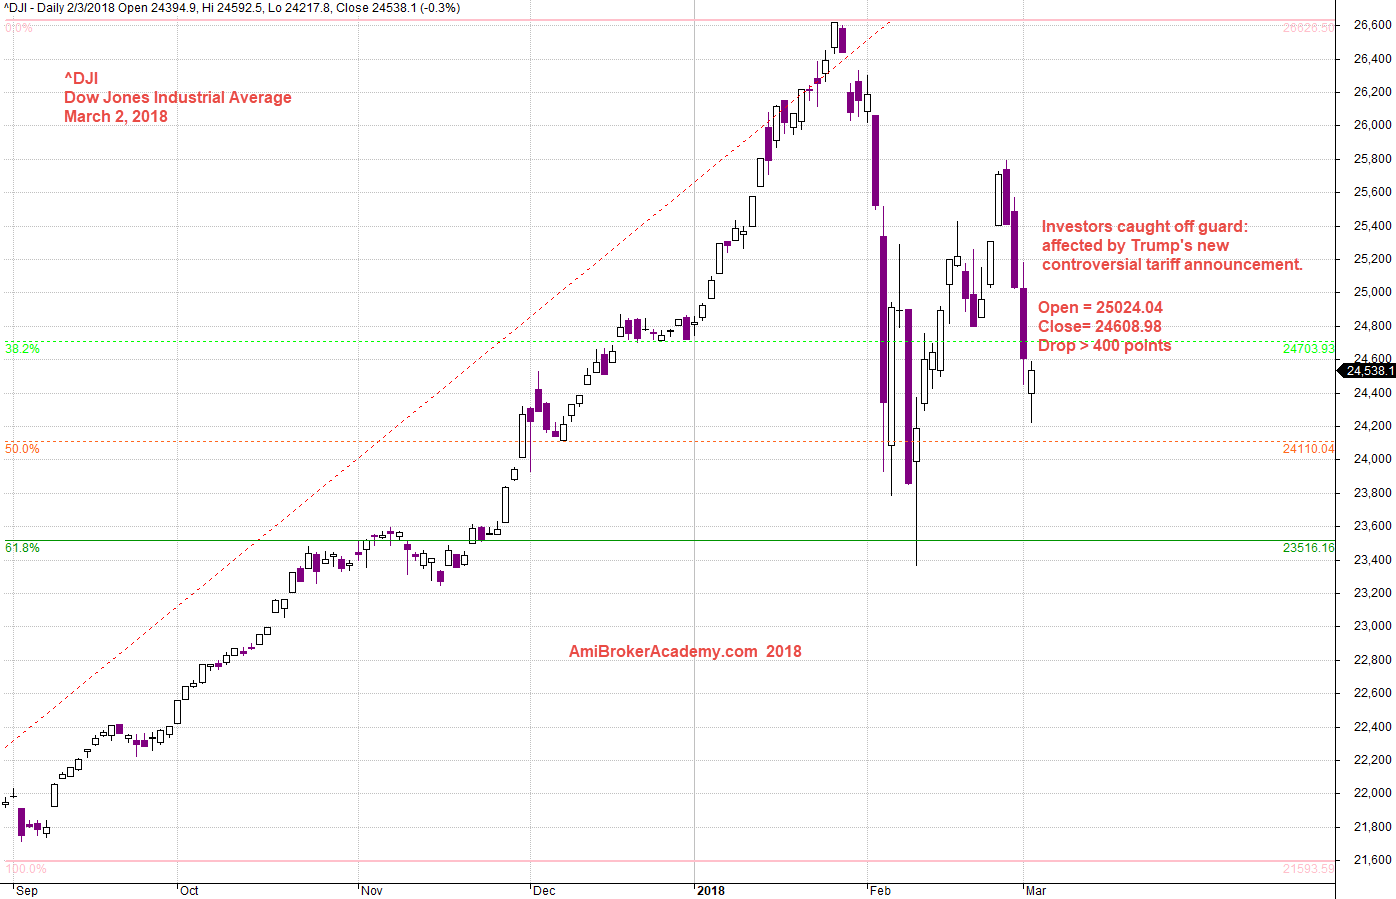
20180302 Dow Jones Industrial Average and Fib Retracement Low to High
Moses US Stock Analysis
AmiBrokerAcademy.com
Disclaimer
The above result is for illustration purpose. It is not meant to be used for buy or sell decision. We do not recommend any particular stocks. If particular stocks of such are mentioned, they are meant as demonstration of Amibroker as a powerful charting software and MACD. Amibroker can program to scan the stocks for buy and sell signals.
These are script generated signals. Not all scan results are shown here. The MACD signal should use with price action. Users must understand what MACD and price action are all about before using them. If necessary you should attend a course to learn more on Technical Analysis (TA) and Moving Average Convergence Divergence, MACD.
Once again, the website does not guarantee any results or investment return based on the information and instruction you have read here. It should be used as learning aids only and if you decide to trade real money, all trading decision should be your own.