6 January 2021
Welcome!
Welcome to AmiBroker Academy dot com, amibrokeracademy.com. Thanks for to be here. We are different from other financial site.
Spot Gold and MACD Indicator
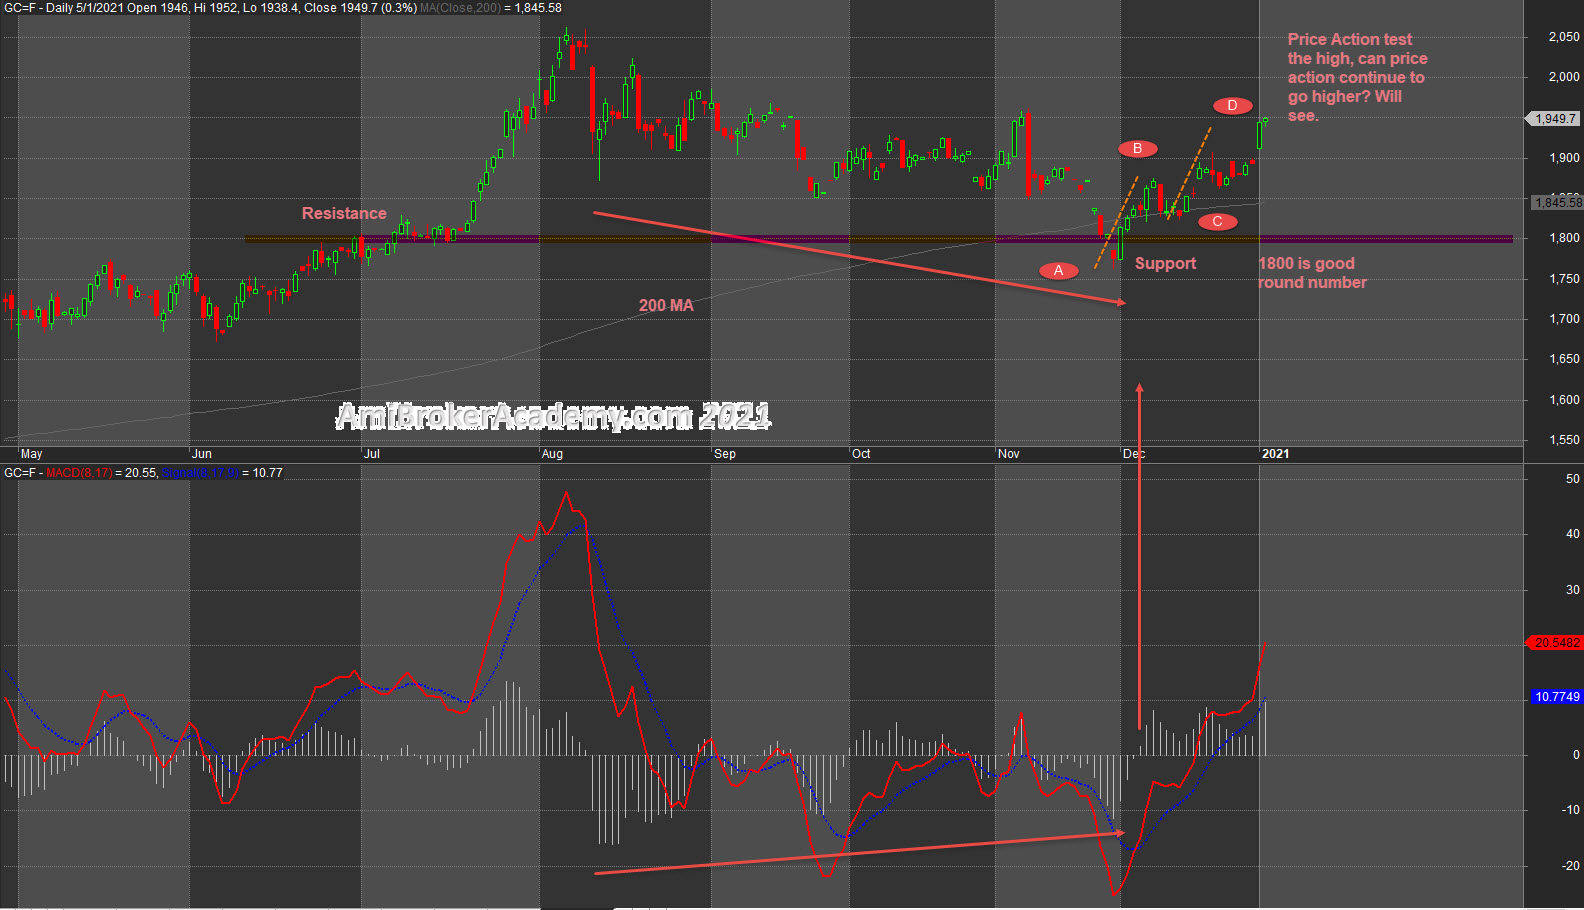
Picture worth a thousand words, study Spot Gold and MACD charting.
2020 year price action test the high and pullback. Price Action pullback to test the resistance and rebounce.
Will Price Action returns back to the 2020 high? What’s your plan for 2021? Manage your risk.
Spot the ABCD pattern?
Have fun!
Manage your risk.
Picture Worth a Thousand Words
Moses Free Stock Charting
Official AmiBrokerAcademy.com Charting
Disclaimer
The above result is for illustration purpose. It is not meant to be used for buy or sell decision. We do not recommend any particular stocks. If particular stocks of such are mentioned, they are meant as demonstration of Amibroker as a powerful charting software and MACD. Amibroker can program to scan the stocks for buy and sell signals.
These are script generated signals. Not all scan results are shown here. The MACD signal should use with price action. Users must understand what MACD and price action are all about before using them. If necessary you should attend a course to learn more on Technical Analysis (TA) and Moving Average Convergence Divergence, MACD.
Once again, the website does not guarantee any results or investment return based on the information and instruction you have read here. It should be used as learning aids only and if you decide to trade real money, all trading decision should be your own.
We learn from many past and present great traders. Kudo to these master.
Side Notes:
You can copy our chart or charts for free, but you can’t copy our mind. Have fun! If you are reference to our chart or charts for whatever good use, please compliment us; indicate where the chart or charts from. We appreciate your kindness gesture. Many may find some of our chart or charts in some of the very interesting site, pxxx